



For proprietary traders looking to profit from short-term market swings, order flow trading is a powerful strategy to consider. While other strategies focus simply on price or volume, order flow trading stands apart for its detailed study of tick-by-tick market auctions. Although this level of analysis makes order flow trading a relatively advanced strategy, it could also unlock profitable opportunities for sophisticated traders.
This article provides a comprehensive overview of order flow trading, including the basic academic theory behind the strategy as well as key tools that order flow traders use. Finally, we look at how prop traders can start analyzing order flow, and the relative pros and cons compared with other trading strategies. For experienced traders looking to implement a rigorous form of market analysis, order flow trading could be a valuable tool.
Key Takeaways
- Order flow trading is a form of technical analysis that involves studying the historical and real-time flow of buy and sell orders in financial markets. This stands in contrast to more basic strategies that solely study price or volume patterns.
- Order flow trading has its roots in an academic field known as Auction Market Theory (AMT). AMT views financial markets as analogous to a continuous auction, in which limit traders and market traders interact to drive price formation.
- By studying order flow analysis, traders can begin identifying key bearish or bullish patterns within order flow data. These patterns can include unfinished auctions, aggressive market traders, and absorptive limit traders.
- Order flow traders rely on several analytical tools to effectively implement their strategy. Level 2 data is often considered the most fundamental order flow tool. Complementary tools include footprint charts, imbalance indicators, and real-time alerts.
Order Flow Trading: An Introduction
Order flow trading is a form of technical analysis, meaning that it relies on studying historical and real-time trading data to identify future potential price action. As a short-term trading strategy, ‘historical’ data may comprise just the past few market ticks, while ‘future’ price action may be no longer than the next minute. Unlike other forms of technical analysis, however, order flow trading is not exclusively focused on price or volume patterns.
Instead, order flow trading seeks to identify patterns within ‘order flow,’ the continuous stream of buy and sell orders that make up all market action. This analysis provides insight into the fundamental process driving price formation, which is ultimately determined by the order flow on the exchange. Simply put, markets with ample demand and weak supply are likely to see prices climb higher, while markets with the inverse will likely see prices fall.
This key order flow insight translates into several actionable trading ideas. For instance, traders can take a long position to ride a wave of robust demand into higher prices. However, order flow trading is not merely a momentum strategy. For instance, rising prices combined with weakening demand may portend a coming reversal.
Because traders need access to tick auction information, order flow trading requires a more granular level of data than other strategies. However, it is also a highly versatile form of analysis, applicable to markets including FX, crypto, commodities, and more. To dive deeper into order flow trading, it will help to take a closer look at the academic theory behind the strategy.
Understanding Market Auctions
Order flow trading has its roots in academia, specifically a field known as Auction Market Theory (AMT). Simply put, AMT views financial markets as a form of continuous auction, in which traders submit bids to buy assets and offers to sell them. Through the interaction of buyers and sellers in this auction, price formation occurs.
To understand how the AMT applies to real-world trading, it’s essential to understand several key concepts. These concepts include the two types of traders on financial exchanges, how these traders interact to execute orders, and how these interactions are batched together on trading systems.
Concept #1: Two Types of Traders
All modern financial exchanges are populated by two distinct kinds of traders:
- Limit traders. Limit traders are the most price-sensitive traders. They’re willing to buy or sell a certain quantity of the underlying asset, but only at a specific price. For instance, a limit trader may enter an order to sell 500 units, but only at a price of $1 or higher.
- Market traders. Unlike limit traders, market traders do not seek to trade at a particular price. Instead, market traders enter an order to purchase a set quantity of units at the current market price, whatever that may be.
Limit trades populate the ‘order book’ for an asset, which displays outstanding bids and offers, including their respective prices and quantities. Intuitively, the highest bid price on an order book must be below the lowest offer price – otherwise, a trade would be executed immediately. This insight brings us to our second key concept.
Concept #2: How Trades Are Executed
On a stable order book, trades are executed when a market order crosses with a limit order. To understand why, imagine a simple order book in which two traders have limit offers to sell 50 units of an asset, one at an ask price of $1.00 and the other at an ask price of $1.02. Assuming that all limit bids are below this price, no trades will occur.
But if another trader enters a market buy to purchase 100 units of the asset, their order will cross with both outstanding limit offers, executing a trade at an average price of $1.01. This example demonstrates how trade execution, which drives all price formation, occurs through the interaction between market and limit traders. When a trade occurs by ‘lifting the offer,’ a market buy executes a limit ask, while ‘hitting the bid’ occurs when a market sell executes a limit bid.
Concept #3: Auction Tick Batching
Order flow trading views the market as a set of historical auctions, studying the supply and demand revealed in these auctions to forecast future price movement. However, trading on financial exchanges occurs in a more or less continuous fashion during open hours. This requires ‘batching’ trades together into discrete auctions, typically based on time intervals.
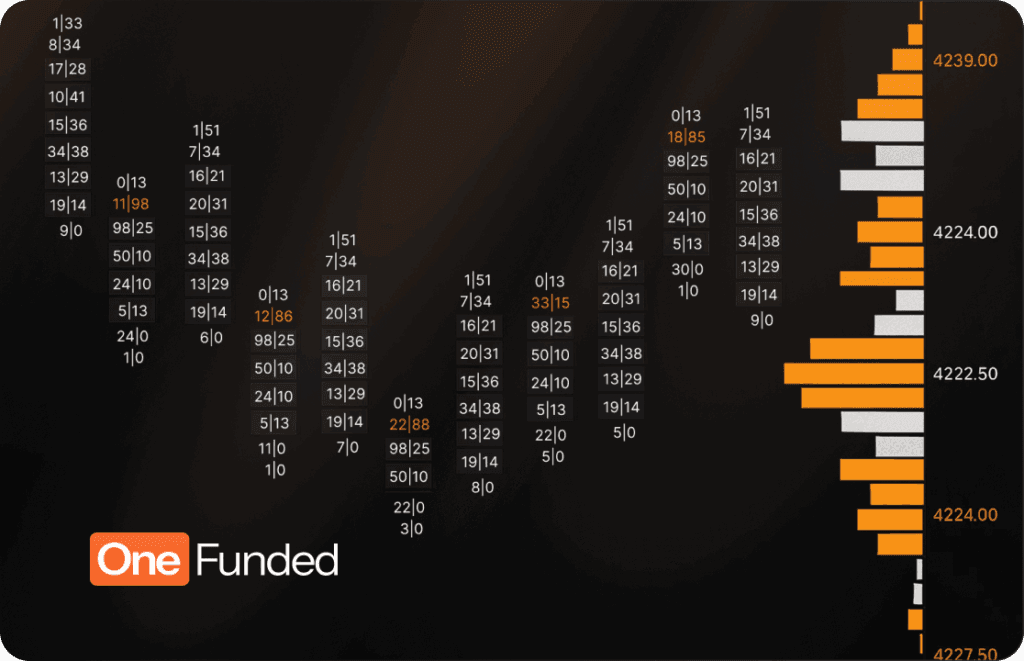
For instance, traders may select ticks with 60-second intervals, aggregating all trades that occur within each minute together. Within each tick, trades would be executed at various prices, with a volume chart showing the total number of completed orders at each price. One popular way to visualize these auctions is the Footprint chart, one of several order flow tools we’ll discuss later.
By batching trades together into discrete auctions like this, traders can study the order flow in a sensible way not possible with unstructured continuous data. The ‘right’ tick length will depend on an individual’s trading strategy, but intervals anywhere from 15 seconds to 5 minutes are common.
Auction Patterns for Order Flow Trading
In the previous section, we analyzed the key concepts of AMT, looking at how batching the interactions of two types of traders makes it possible to study markets as an auction. In this section, we’ll put this study into practice, exploring various auction patterns traders may encounter. By analyzing these patterns, order flow traders can begin to forecast price movements that may occur in subsequent ticks.
Pattern #1: The Unfinished Auction
To understand the unfinished auction pattern in financial markets, it helps to start by imagining a true auction house. Assume that in this auction house, an asset is bid higher and higher until it eventually reaches a price that no participant is willing to pay. This auction can be considered ‘finished,’ as the bidding process discovered the price above which demand for the asset was completely exhausted.
In contrast, imagine that the auction was disrupted halfway through, when there were still multiple bidders who may have been willing to pay a higher price for the asset. We can consider this auction ‘unfinished.’ When the auction resumes, it’s reasonable to assume that the price will continue to drift higher, since there is no evidence that buying pressure was exhausted.
The same logic can apply to tick auctions in financial markets. If price-sensitive traders are still willing to bid at the highest prices, then the market hasn’t discovered a price to exhaust all buying pressure yet. Correspondingly, if price-sensitive traders are still willing to offer at the lowest prices, selling pressure remains.
This logic translates into two types of unfinished auction patterns, one bullish and one bearish:
- A bullish unfinished auction occurs when limit bid contracts continue to be executed at a tick high.
- In contrast, a bearish unfinished auction occurs when limit ask contracts continue to be executed at a tick low.
Simply put, a bullish unfinished auction shows that buyers may have been willing to quote an even higher bid price. However, a bearish unfinished auction shows that sellers may have been willing to quote an even lower offer price. Both patterns can be considered momentum indicators, since the most price-sensitive traders may continue driving the trend until the auction completes.
Pattern #2: Aggressive Market Trading
In the first pattern, we focused on limit trader activity, looking for evidence of price-sensitive supply and demand in the order flow. However, it’s also possible for price-insensitive supply and demand to impact prices. This can occur when aggressive market traders are looking to acquire or dispose of a relatively large position in a short period of time.
One way to identify aggressive market trading is to look for imbalances in trade execution. If the volume of limit offers being executed dwarfs limit bids, it could be an indication of an aggressive market buyer. (Recall that market buys lift the offer by executing against limit sells.) If this imbalance persists across multiple ticks, the buyer may continue to clear order book offer liquidity, driving prices upward as limit traders quote higher sale prices in response.
In contrast, an imbalance toward limit bids may reveal an aggressive market seller. If this seller continues to hit the bid, limit traders may quote lower and lower purchase prices. This pattern is intuitive – aggressive buyers are a bullish sign while aggressive sellers are a bearish one.
Crucially, aggressive trading can only be identified as imbalances paired with a multi-tick trend of rising or falling prices. If imbalances occur with relatively stable prices, the pattern may actually be absorptive, not aggressive.
Pattern #3: Absorptive Limit Trading
In the previous section, we described a pattern in which limit traders are forced to quote higher or lower prices in response to aggressive imbalances in either direction. This is not the only outcome of an imbalance, however. In absorptive situations, limit traders are happy to ‘absorb’ imbalances without significant price shifts.
This absorption may occur for several reasons. One is that limit traders have a strong sense of the fundamental worth of the underlying asset, and are not willing to buy or sell at a price far removed from that. Another is that limit traders are looking to either acquire or dispose of a large block of shares to balance their own inventory, and are happy to use the imbalance to accommodate that.
In either case, absorptive patterns should be seen as a sign of potential resistance in the order flow. For example, suppose that there is a multi-tick imbalance toward offer execution, indicating an aggressive market buyer. However, a limit trader continues to absorb this aggression by quoting large blocks of the asset around $70, leading to a relatively stable price over time. This may be seen as a sign of resistance around $70, showing that bullish trends may struggle to break through this level.
Key Tools for Order Flow Trading
As a sophisticated form of market analysis, order flow trading requires equally sophisticated tools to be conducted effectively. In this section, we’ll explore five key tools for order flow traders to consider. These tools can be used in conjunction to identify patterns and trends, although which tool a trader finds most useful will depend on their individual style.

Tool #1: Level 2 Data
The first (and arguably most essential) tool for order flow trading is level 2 trading data – also known as Depth of Market. Level 2 data provides a real-time display of current limit orders outstanding on the ‘order book’ for a particular asset. This granular level of data allows traders to see each outstanding bid and offer order at their respective quantity and price levels.
While traders typically need to pay extra to access level 2 data, it is a significant jump over level 1 data, which merely shows the best available bid and ask price for an asset. For serious order flow traders, level 2 data is all but essential to understand current market auction conditions.

Tool #2: Footprint Charts
Footprint charts are a unique type of financial chart that incorporates a significant volume of information into a compact format. Order flow traders can utilize footprint charts to see high and low prices at each tick, as well as the volume of bid and ask orders executed at each price level. These charts can typically be customized to align with a trader’s desired tick interval, effectively summarizing auction activity over time.

Tool #3: Imbalance Indicators
Imbalance indicators are statistical metrics that calculate the level of volume imbalances in the market, either at a given moment on the order book or over a specific historical interval. One basic example of an imbalance indicator is the volume delta – the difference between market buys and market sells in a given period. In conjunction with price trends, imbalance indicators can reveal aggressive or absorptive activity.

Tool #4: Volume Profile Charts
Volume profile charts are a close cousin of footprint charts. These charts display the prices at which the most trading activity took place for a particular asset over a certain time period. This activity is typically visualized as a histogram for easy analysis, with large spikes indicating heavy areas of trading activity. While footprint charts offer granular tick-by-tick volume data, volume profile charts are able to provide a quick overview of activity over varying timescales, such as a single hour or trading session.

Tool #5: Power Trader Alerts
Finally, order flow traders often benefit from real-time trading alerts, especially when identifying power trader activity. Power traders, who can drive significant trading volume in a short period of time, may be responsible for driving or reversing price trends. Power trades can potentially include large financial institutions, hedge funds, or even high-net-worth investors. Because their trading activity may not last long, alerts based on a higher-than-average volume during a particular window can allow order flow traders to capitalize on these movements.
Order Flow Trading: Pros and Cons
Order flow analysis remains a popular strategy for traders with the sophistication and expertise to employ it. However, this approach is not without downsides. In this section, we’ll explore the pros and cons of order flow trading to help you decide whether this approach is right for you.
Pros: Versatility, Flexibility, Reliability
- Versatility. Order flow trading is a highly versatile form of technical analysis. This strategy can be applied to markets as diverse as crypto, FX, or equities, making it a powerful option for traders who work across asset classes. So long as an exchange features the traditional pairing of limit and market traders, the foundations of order flow analysis remain the same.
- Flexibility. Order flow analysis also stands out for its flexibility. This is not an all-or-nothing trading strategy that requires a trader to abandon other tools. Traders who learn to study order flow can use it as their primary analytical tool or as a supplement, depending on their style.
- Reliability. To be sure, there’s no such thing as a foolproof trading strategy, and order flow trading is not an exception. However, this form of analysis rests on the close study of order execution, which is the process that drives price formation on financial exchanges. This should make traders more confident in the reliability of order flow trading when compared to strategies based purely on historical price patterns or trader sentiment.
Cons: Complexity, Learning Curve, Cost
- Complexity. Order flow trading is a relatively complex form of analysis that is likely most suitable for experienced traders. Order flow traders need to weigh a significant volume of information when making their decisions, including both historical and real-time tick data. Pair that with the multitude of potential tools available, and it can be easy to get lost in an ocean of information.
- Learning Curve. This strategy’s complexity is closely tied to its learning curve. Compared to other strategies, traders will likely need a longer period of study to gain the knowledge and confidence necessary to successfully employ order flow trading. In particular, Auction Market Theory can provide a significant academic hurdle for newer traders.
- Cost. Finally, order flow trading can sometimes be a more expensive form of analysis. Not only might traders have to pay for greater data access, but advanced tools and alert systems can sometimes cost more as well. Nonetheless, this cost needs to be balanced against the potential for greater profits resulting from superior analysis.
In short, the power of order flow trading can also be a potential pitfall. While studying order flow can provide unique insights into price formation on the market, it is not always a simple or straightforward process. Nonetheless, many traders who employ the time, energy, and capital into mastering order flow analysis find the process a worthwhile investment.
Order Flow Trading: Common Mistakes
While order flow analysis can help enhance your overall trading strategy, there are some common mistakes to watch out for. These include overreliance on a single data point, inadequate risk management, and forgetting the bigger picture.
Mistake #1: Relying on a single data point
As we discussed, one of the drawbacks of order flow trading is the complexity and volume of data that traders have to navigate. For any reasonably popular financial asset, orders are constantly flowing onto the exchange during trading hours. This means that relying on a small number of data points to make a trading decision can be dangerous.
For example, an unusual volume spike tied to aggressive market buys could indicate a power trader entering the market. However, confirming whether this is truly a bullish trend would involve studying preceding price trends, identifying previously tested resistance levels, and evaluating the outstanding order book to see if limit traders can absorb the power trader. While the volume spike might turn out to be meaningful, other data points can be used to verify and validate the trend.
Mistake #2: Poor risk management
Even once traders believe they have identified a meaningful pattern in order flow, it’s important to be cognizant of position sizing and risk management when executing any potential trades. While order flow patterns can be useful to forecast price movements, trends are not guaranteed to play out as expected, and reversals can be swift. By incorporating a proper risk management framework, traders can avoid impairing their capital and allow their edge to play out in the long run.
Mistake #3: Forgetting the bigger picture
Finally, while order flow trading is a micro-focused form of analysis, traders shouldn’t forget about the macro picture surrounding financial markets. For instance, an FX trader identifying unusual order flow patterns in a particular currency pair may be tempted to take a certain position based on the data. However, if news recently broke that the political situation in one of those countries is deteriorating, that trader may be taking on unanticipated risks.
These common mistakes can pose a threat to any trader practicing order flow analysis. But by incorporating varied data points, practicing proper risk management, and staying informed about macro developments, order flow traders can try to avoid these hurdles and potentially secure greater profits.
How to Start Order Flow Trading: Step by Step
Looking to start your order flow trading journey? Like all trading strategies, education is the first step toward execution.
Step #1: Education
To begin order flow trading, aspiring traders should familiarize themselves with all aspects of this trading strategy. That includes the interaction between market traders and limit traders, the various patterns that can emerge in order flow, and key tools to supplement your analysis. Popular books related to order flow trading include Mind Over Markets by James Dalton and Steidlmayer on Markets by J. Peter Steidlmayer.
Step #2: Platform Selection
Next, order flow traders should pick the platform they’d like to trade on. For prop traders looking to begin order flow trading, OneFunded is a competitive choice that features virtual account trading as a pathway to a fully funded account. TradeLocker, OneFunded’s trading platform, links directly with TradingView, which features powerful order flow trading tools.
Step #3: Asset Selection
Next, order flow traders must consider what assets they’d like to trade. Thankfully, order flow analysis can be used on many different markets, meaning that traders have a wide range of choices. At OneFunded, supported assets include crypto, FX, and equities.
Step #4: Market Analysis
Once traders are set up on their platform of choice and have selected a market to trade, they can begin conducting market analysis. By leveraging footprint charts, level 2 data, volume profiles, and other analytical tools, order flow traders can identify patterns and trends. To get comfortable with this strategy, new order flow traders might consider testing their analysis skills in a simulated trading environment before moving on to live trading.
Step #5: Execution
Finally, order flow traders can begin actually executing trades. For some traders, order flow analysis may form just a small part of their analytical toolkit – for others, it may comprise their entire approach. In either case, analyzing order flow can be a valuable skill for sophisticated traders looking to execute profitable trades.
Conclusion
For prop traders looking to take their strategy to the next level, incorporating order flow analysis into their approach is worth considering. While the learning curve can be steeper than other strategies, gaining insight into market dynamics could help ease your path to profits. To start their order flow journey, traders can begin by studying Auction Market Theory, recognizing key auction patterns, and building their order flow toolkit.Looking for a platform to start order flow trading? Put your skills to the test with OneFunded’s virtual funded accounts. After picking your account size and hitting profit targets consistently, you could be on your way to a fully funded account. And with a trading environment that replicates the real market down to the tick, you can seamlessly put order flow trading into practice.