




Understanding price action is one of the most powerful skills a trader can develop. At the core of this lies Japanese candlesticks, along with price patterns and candlestick formations that help you interpret market psychology.
This guide breaks everything down from the ground up — in a practical, trader-focused way.
1. What Are Japanese Candlesticks?
Japanese candlesticks are a way of visualising price movement over time. Each candle represents a specific time period (1 minute, 5 minutes, 1 hour, daily, etc.).
A single candle tells you a story about who was in control — buyers or sellers.
Candle Structure (Quick Recap)
Each candlestick consists of:
- Open – price at the start of the period
- Close – price at the end
- High – highest price reached
- Low – lowest price reached
Candle Types:
- 🟢 Bullish Candle → Close is above the Open (buyers in control)
- 🔴 Bearish Candle → Close is below the Open (sellers in control)
Key Insight:
Candles are not just shapes — they represent order flow and sentiment.
2. Market Psychology Behind Candles
Every candle answers a key question: Who won the battle during this time period?
Examples:
- Strong bullish candle → aggressive buying, little resistance
- Long upper wick → buyers pushed price up but got rejected
- Long lower wick → sellers pushed down but buyers absorbed it
Most traders fail here – they memorise patterns but don’t understand why they form.
3. Single Candlestick Patterns
These patterns give insight into potential reversals or continuations.
Doji
- Open ≈ Close
- Indicates indecision
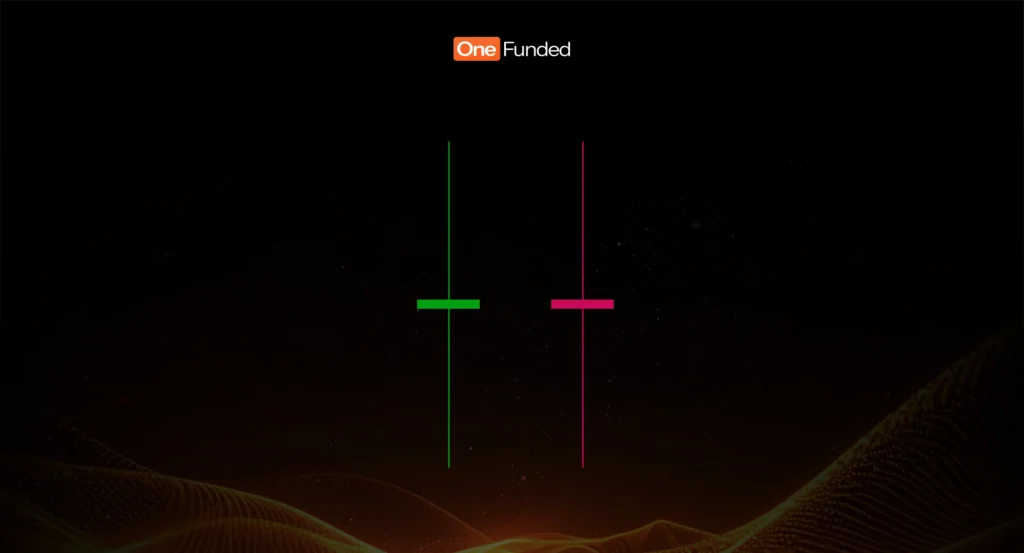
Often appears before a reversal or during consolidation.
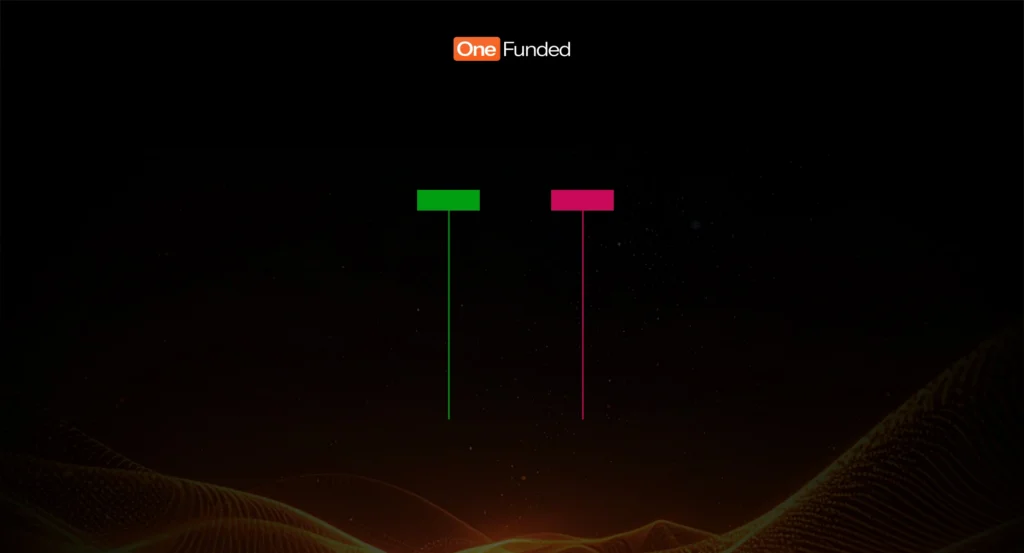
Hammer
- Small body, long lower wick
Meaning: Potential bullish reversal
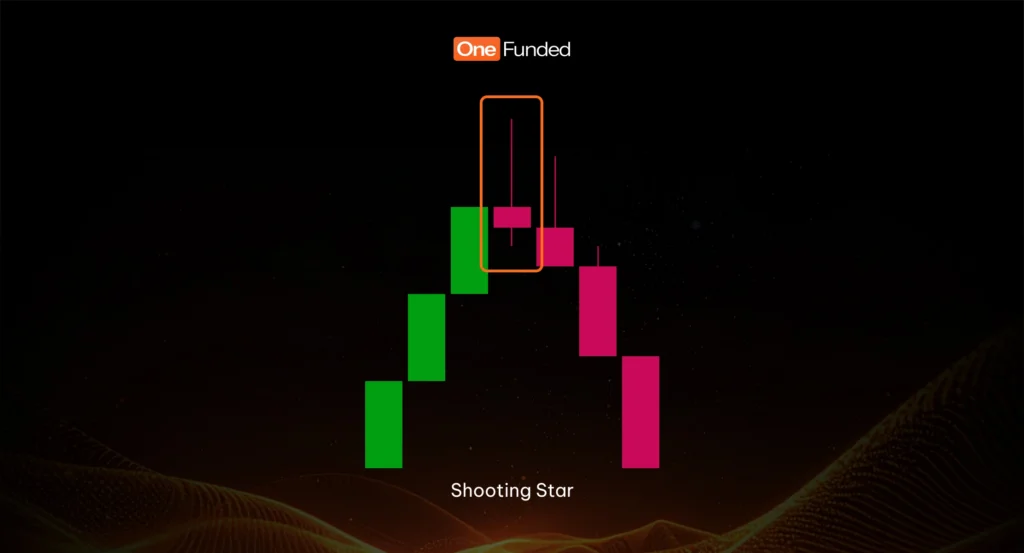
Shooting Star
- Small body, long upper wick
- Appears after an uptrend
Buyers failed to hold higher prices.
Meaning: Potential bearish reversal
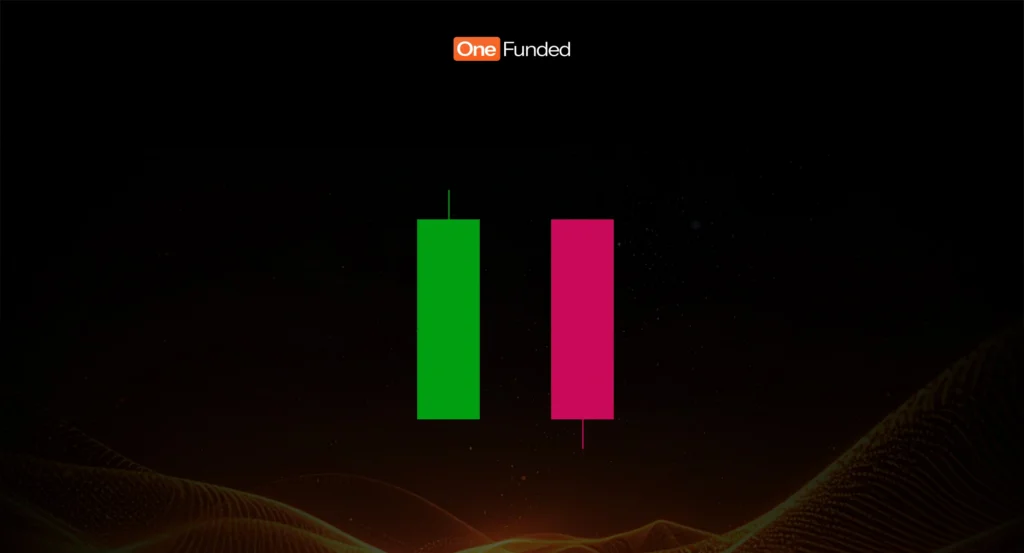
Marubozu
- No wicks, strong body
Pure dominance:
- Bullish → strong buying
- Bearish → strong selling
4. Multi-Candle Patterns
These patterns are more reliable because they show interaction over multiple periods.
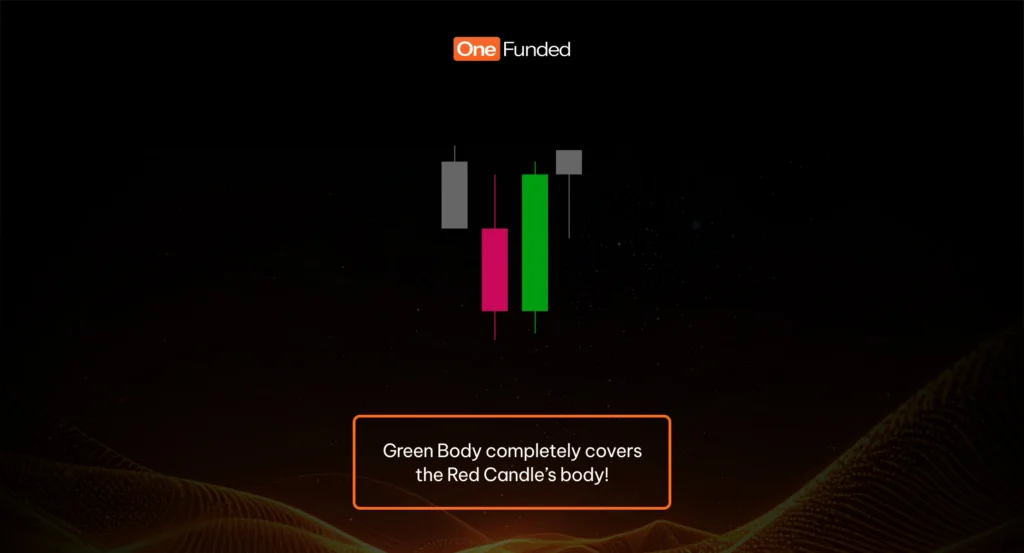
Bullish Engulfing
- Small bearish candle followed by a larger bullish candle
- The bullish candle fully engulfs the previous one
Buyers completely overpower sellers.
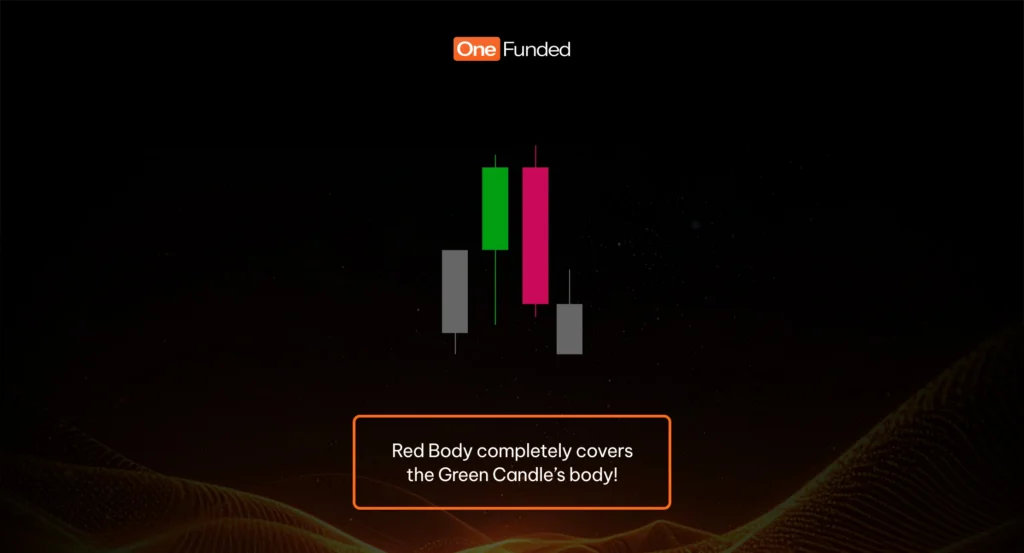
Bearish Engulfing
- Opposite of bullish engulfing
Sellers take full control.
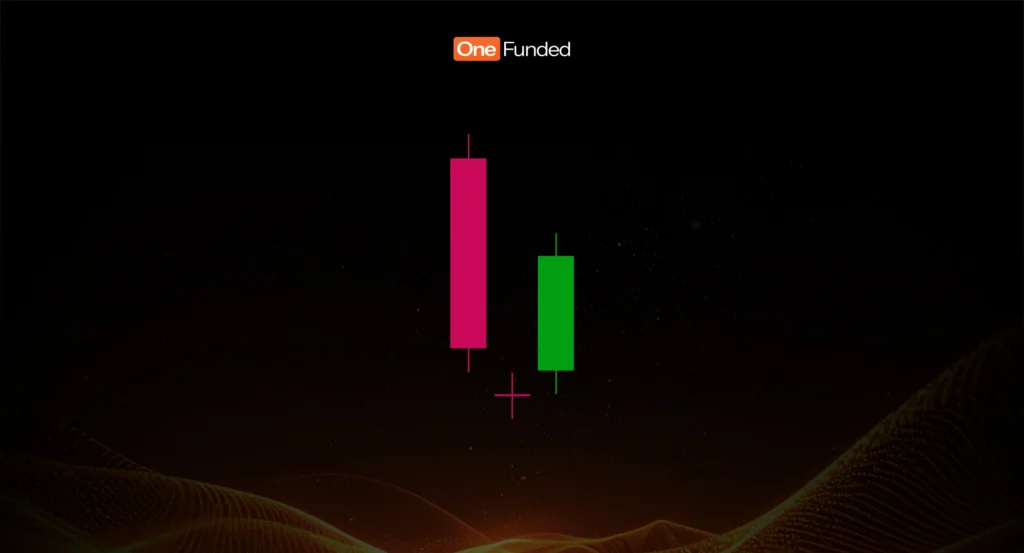
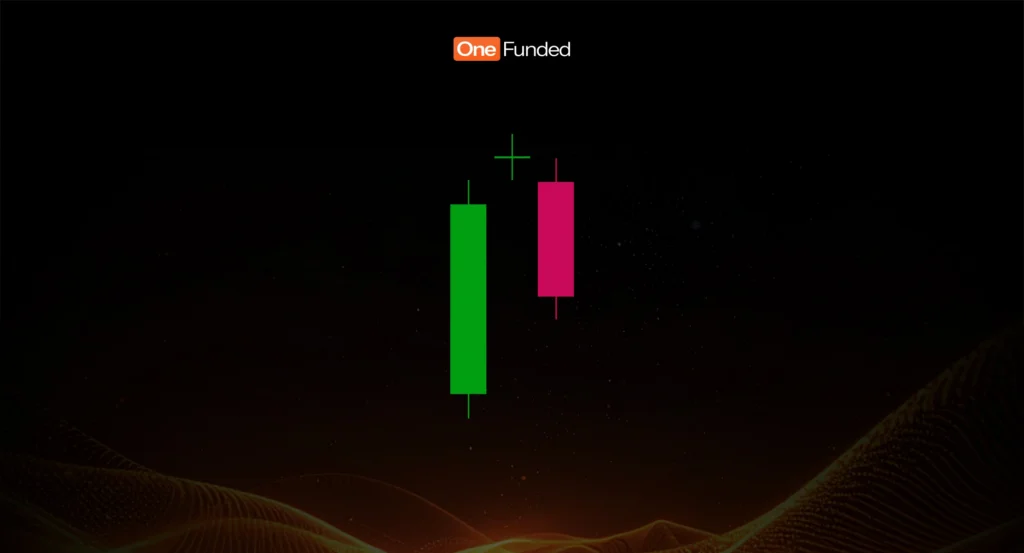
Morning Star
- Bearish → indecision → strong bullish
Transition from selling pressure to buying dominance.
Evening Star
- Opposite of morning star
Signals potential bearish reversal.
5. Why Candle Patterns Alone Are Not Enough
One of the biggest mistakes traders make is relying on candlestick patterns as a standalone entry signal.
A pattern is not a trade. The same pattern can mean completely different things depending on where it appears:
- A bullish engulfing in a strong downtrend → often just a pullback
- A bullish engulfing at key support in an uptrend → high probability setup
Without context, a pattern is just a shape — not an edge.
Correct Way to Use Them
- ❌ Pattern = Entry
- ✅ Context + Pattern = Confirmation
You will learn more about how to apply Candle Patterns in the course of the OneFunded Academy.
Final Thought
Most beginners try to memorise patterns.
Professionals think differently: “What is the market trying to do — and who is trapped?”Candlesticks are a language of price.
When you understand them properly, you stop reacting — and start anticipating.