





Before you can trade profitably, you need to understand the language of price. Market structure is that language — it tells you who is in control, where momentum is heading, and precisely when that story is changing.
What Is Market Structure?
Market structure is the study of how price moves through a series of highs and lows over time. Every chart, on every timeframe, tells a directional story through these swing points. Learning to read them correctly is the single most important skill a technical trader can develop.
At its core, price can only do three things: trend upward, trend downward, or move sideways in a range. Market structure gives you the objective framework to identify exactly which of these three states the market is in at any given moment — and, critically, to recognise when that state is changing.

The Three Market States
Bullish Structure — Uptrend
A bullish market structure is defined by a consistent pattern of Higher Highs (HH) and Higher Lows (HL). Each rally pushes price above the last peak, and each pullback holds above the last trough. Buyers are firmly in control. As a trader, your bias in this structure should be to look for buying opportunities — ideally when price pulls back into a Higher Low zone.

Bearish Structure — Downtrend
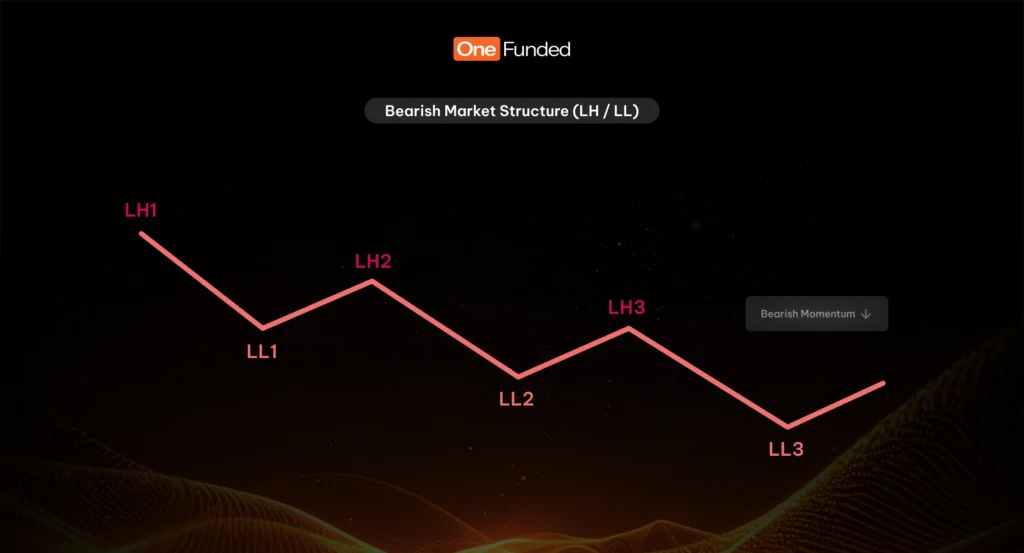
A bearish market structure is defined by a consistent pattern of Lower Highs (LH) and Lower Lows (LL). Each rally fails to reach the prior high, and each selloff drives price below the prior low. Sellers are in control. In this environment, your bias should be to look for selling opportunities — ideally when price rallies into a Lower High zone.
Range — Sideways Market
When price is neither making consistently higher highs and higher lows, nor lower highs and lower lows, it is in a range. Price oscillates between two relatively equal levels: a range high (resistance) and a range low (support). This is covered in full in the section below.
How to Draw Market Structure
One of the most common mistakes new traders make is over-marking their charts. They connect every single candle wick and end up with a confusing web of lines that tells them nothing useful. The goal is to identify significant swing points only.
- Choose your timeframe. Market structure exists on every timeframe, but always start from the higher timeframe (HTF) first — weekly, daily, or 4H. This gives you the directional bias. Lower timeframe structure should only be traded in alignment with the HTF direction.
- Identify significant swing highs and lows. A valid swing point is one where price made a clear and visible turn. Look for candles with obvious rejection — long wicks or strong reversal candles. Small pullbacks within a smooth move are not true swing points.
- Connect the dots. Once you have your swing highs and lows marked, look at the sequence. Are the highs getting progressively higher? Are the lows also rising? That is bullish structure. Are the highs getting lower and the lows also falling? Bearish structure.
- Mark only what matters. Use horizontal lines or dots to mark your swing points, not full horizontal lines across the entire chart. Keep the chart clean. You are mapping the story of price, not decorating it.
- Update in real time. Market structure is not static. As new candles form, new swing points emerge. Continuously reassess whether the current structure is still intact or whether a shift is occurring.
KEY PRINCIPLE
Always identify market structure from the highest timeframe down. A sell setup on a 15-minute chart means very little if the daily chart is in a clear bullish uptrend. Trade with structure, never against it.
Break of Structure (BoS) & Market Structure Shift (MSS)
These two concepts are at the heart of understanding when a market is continuing its trend versus when it is reversing. They look similar on the surface, but they carry very different meanings — and confusing them is one of the costliest errors in technical trading.
Break of Structure (BoS)
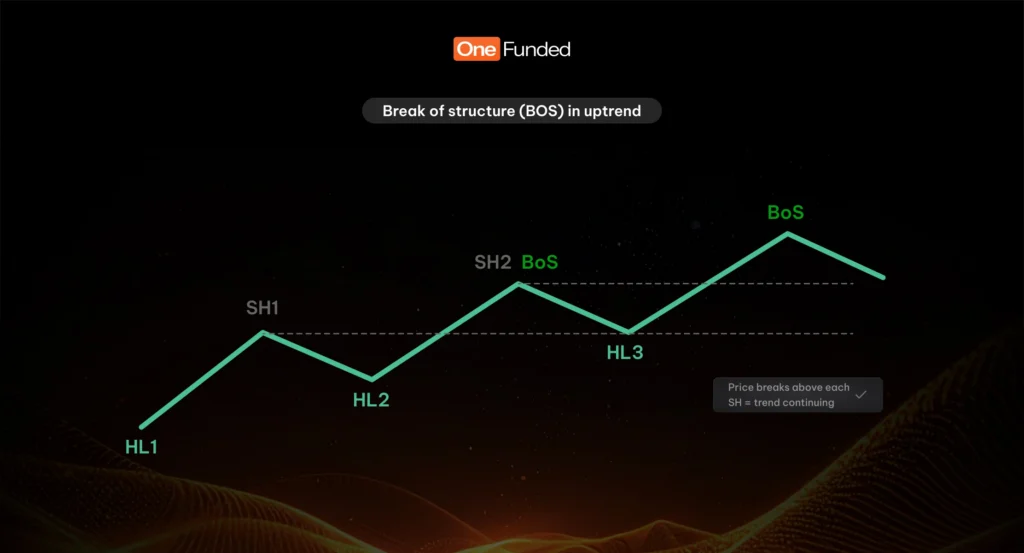
A Break of Structure occurs when price breaks through a swing high or swing low in the direction of the existing trend. It is a continuation signal — it tells you the trend is alive and well.
In an uptrend, a BoS happens when price breaks above a previous swing high. In a downtrend, a BoS occurs when price breaks below a previous swing low. Each BoS confirms that the dominant players (buyers in a bull trend, sellers in a bear trend) are still in control.
Market Structure Shift (MSS)
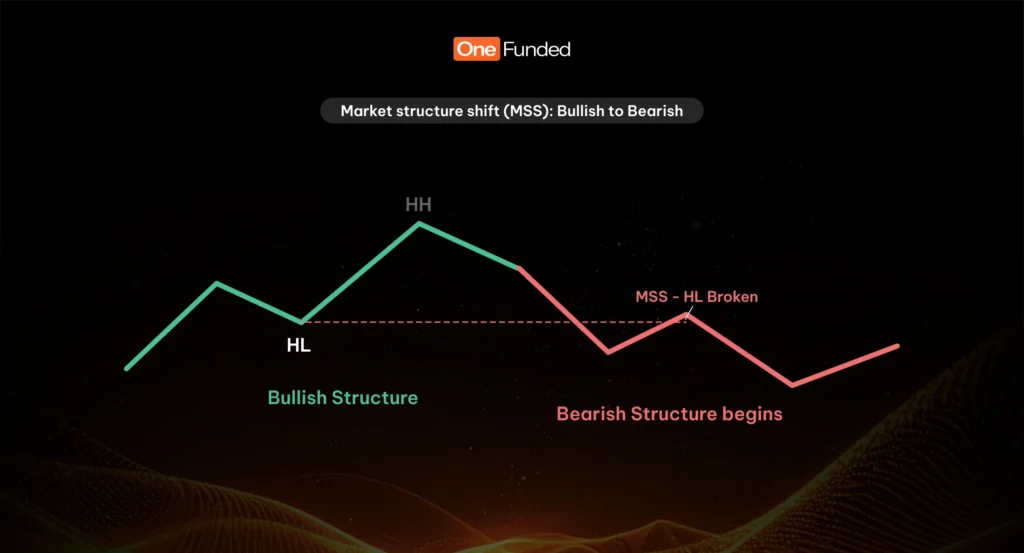
A Market Structure Shift is the moment when price breaks a swing point against the direction of the existing trend. This is a reversal signal — it is the first indication that the market may be changing hands from buyers to sellers, or vice versa.
In an uptrend, an MSS occurs when price breaks below a Higher Low — a level that was previously defended by buyers. This is significant because it means sellers are now strong enough to overpower the buyers who were holding that level. In a downtrend, an MSS occurs when price breaks above a Lower High.
An MSS does not automatically mean you should trade the reversal immediately. It is a warning sign — a shift in the narrative. You should wait for the new structure to confirm before committing to a trade in the new direction.
COMMON MISTAKE
Many traders confuse a normal pullback with an MSS. Not every dip in an uptrend is an MSS — only a break of the most recent Higher Low qualifies. If price pulls back but holds above the prior HL, the bullish structure is still intact.
BoS vs MSS — Side-by-Side Comparison
| BREAK OF STRUCTURE (BOS) | MARKET STRUCTURE SHIFT (MSS) | |
| Direction | With the trend | Against the trend |
| Signal type | Continuation | Reversal warning |
| In uptrend | Price breaks above a prior swing high | Price breaks below a prior Higher Low |
| In downtrend | Price breaks below a prior swing low | Price breaks above a prior Lower High |
| Trading implication | Look to continue trading in trend direction | Be cautious; wait for new structure to confirm before reversing |
Range Markets
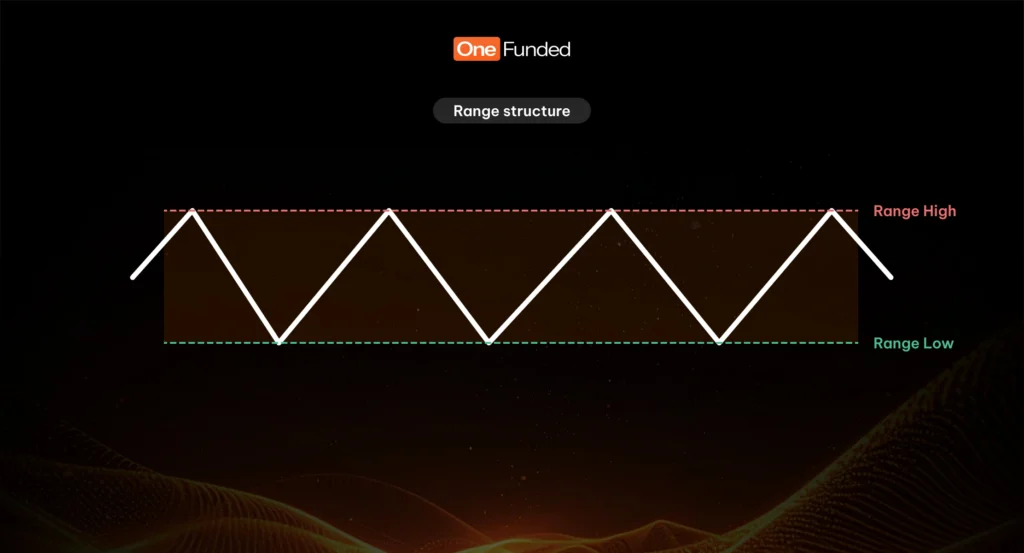
A range is a period where price is oscillating between two defined levels without making a clear series of higher highs/higher lows or lower highs/lower lows. Instead, price is essentially in equilibrium — buyers and sellers are evenly matched, and neither side has taken decisive control.
Ranges are far more common than most traders realise. Markets spend the majority of their time consolidating, not trending. Understanding how to identify, draw, and trade a range is therefore not optional — it is essential.
How to Identify a Range
A range forms when price tests the same high and the same low level at least twice each. The top of the range is called the resistance (or range high), and the bottomis called the support (or range low). The area between them is the range body — this is where price will fluctuate until a breakout occurs.
Trading Within a Range
Once a range is identified, the logic is straightforward: buy at the range low, sell at the range high. You are essentially fading extremes, trading the mean-reversion nature of the range.
However, never do this blindly. Before entering at the range low, look for evidence that buyers are stepping in — bullish candle formations, rejection wicks, or a lower timeframe MSS to the upside. The same applies in reverse at the range high: look for signs of seller presence before shorting.
BEST PRACTICE
Only trade range extremes. The middle of the range is a no-trade zone. Risk-reward is poor in the middle, and price can whipsaw in either direction. Wait for price to arrive at one of the two boundaries before looking for a setup.
The Range Breakout
Every range eventually resolves in a breakout. When price closes convincingly beyond the range high or range low, the range is over and a new trend may be beginning. A breakout above the range high is bullish — the buyers have won. A breakout below the range low is bearish — the sellers have prevailed.
Beware of fakeouts. Price will often pierce one side of the range briefly, triggering stop losses and trapping breakout traders, before reversing sharply back inside. This is sometimes called a liquidity sweep or stop hunt. A genuine breakout is typically confirmed by a strong candle close beyond the range boundary — not just a wick.
Summary
Market structure is the foundation upon which all technical trading decisions should be built. Before worrying about indicators, patterns, or entry triggers, you must know what the market is doing at the macro level. Is it trending? Is it ranging? Is it in the process of shifting direction?
Once you can answer those questions clearly and confidently, you will stop taking random trades and start trading with genuine context. You will understand why a level matters, where price is likely to go next, and when the market is telling you the story has changed.
📌 TO REMEMBER:
BoS = Continuation. The trend is alive. Look to trade in the direction of the trend.
MSS = Warning. The trend may be ending. Wait for confirmation before trading the new direction.
Range = Equilibrium. Sell the high, buy the low, and wait for the breakout to tell you who won.