Each day, trillions of dollars in value change hands in global financial markets. But while individual investors and traders account for some of this volume, they’re not the driving force in most markets. Instead, the vast majority of global daily trading volume is due to institutional activity.
For traders looking to capitalize on market trends, this fact has an important implication: understanding the behavior of major financial institutions can be a powerful tool in analyzing where prices might be headed. These institutions, which include banks, hedge funds, and sovereign wealth funds, are collectively known as ‘smart money’ – and for good reason. Often, these entities are trading based on sophisticated research and analysis.
In this article, we’ll be discussing the concept of smart money and how traders can profit by understanding institutional behavior. Smart money trading can often be the cause behind rising prices, market sell-offs, and swift reversals between the two. Individuals may be just a small part of the overall market, but they can often profit by riding the waves created by large institutions.
Key Points:
- Institutions Drive Volume: Financial markets are overwhelmingly dominated by ‘smart money’ traders – major institutions like banks, hedge funds, and sovereign wealth funds. For example, in the forex market, retail traders account for just 2.5% of global daily volume based on the latest estimates.
- Size Impacts Price: Institutions typically have much larger trade sizes than individuals, often exceeding $250,000 per trade. When these large trades exhaust available liquidity at specific price levels, they can force a mechanical repricing of the asset as market makers seek to balance their inventory.
- Detectable Footprints: While institutional activity is anonymous in public markets, it can often leave lasting evidence in the order book. For instance, traders can sometimes spot smart money activity through block trades, imbalance gaps, and liquidity sweeps (where clusters of orders are rapidly absorbed by significant trades).
- Riding the Wave: The point of conducting smart money analysis isn’t to help individual traders compete directly with institutions, which can be challenging. Instead, profitable strategies often involve identifying the direction of institutional trading flows and ‘riding the wave’ created by these large-scale portfolio shifts.
How Smart Money Works: Why Institutions Drive Markets
At first glance, the concept of ‘smart money’ might seem akin to a conspiracy theory, with shadowy financial institutions serving as the driving force behind price action in markets. But in reality, the situation isn’t so ominous. Large institutions have an outsize impact on markets for just that reason – they’re large.
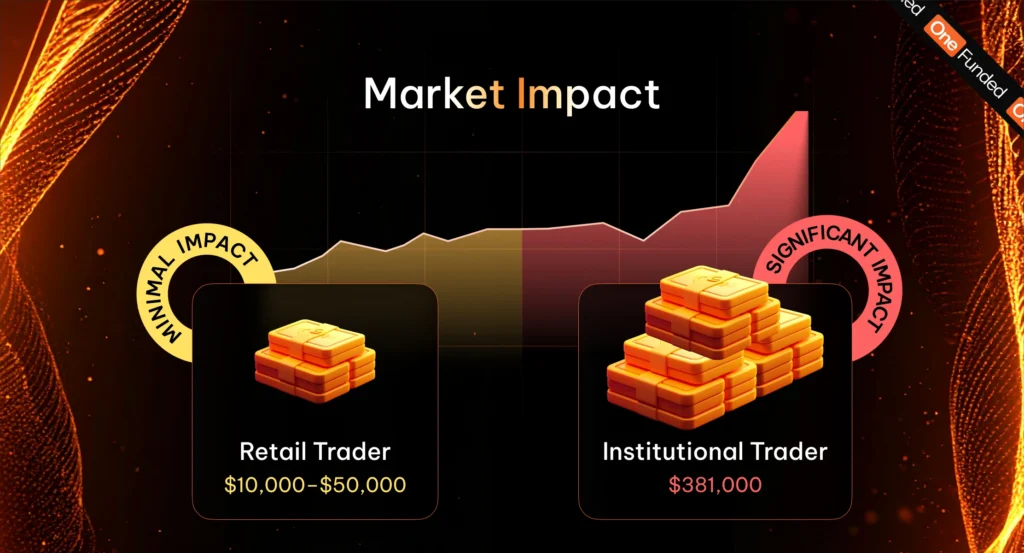
As one example, consider the US corporate bond market, which is almost exclusively dominated by institutional players. In 2024, the average size of an individual trade was an astonishing $381,000 – far larger than the total portfolio sizes for many retail traders. Given the size discrepancies between institutional and individual pools of capital, it should be no surprise that smart money can drive markets.
Importantly, this doesn’t mean that institutions control market forces in the long term. Trends that take shape over months or years are typically driven by fundamental factors like corporate earnings, interest rates, and economic growth. But in the near term, portfolio adjustments by large institutions can shift prices for hours, days, or even weeks. To explain why, it helps to understand how institutions and liquidity providers interact in the marketplace.
Smart Money by Markets: Which Asset Classes are Driven by Institutions?
As we’ve discussed, institutions can have a profound impact on prices in financial markets. But that impact isn’t equal across asset classes. Some asset classes are more strongly driven by institutional behavior than others:
- Stocks. Equities are one of the orders least driven by major institutions – but that doesn’t mean that retail traders hold a major share. According to analysis from JPMorgan, retail activity is responsible for about 36% of order flow on US exchanges as of 2025. While that still leaves institutions driving two-thirds of the market, retail’s order share is up from about 10% prior to 2020.
- Bonds. Retail traders are responsible for a fraction of trading volume in bond markets. According to one estimate by SIFMA, retail traders were responsible for just 7% of US corporate bond trading volume in 2023. That shouldn’t be a surprise, considering that bonds are typically traded in ‘round lots’ often worth $100,000 each.
- Forex. The foreign exchange market is almost entirely driven by major institutions. Based on the Bank for International Settlements Triennial Central Bank Survey, retail traders drove about 2.5% of FX market volume in 2025.
- Crypto. Although crypto isn’t usually considered a traditional financial market, it still remains heavily influenced by institutional players. While collecting centralized data is challenging, a report from Coinbase in 2024 indicated that just 21% of volume on the platform was retail-driven, with the remainder reflecting institutional activity. Institutions have grown increasingly active in crypto as listed funds make their way onto traditional exchanges.
- Commodities. Like crypto, establishing the role of institutions in commodity markets can be challenging due to a lack of data. However, reporting from the CFTC on ‘non-reportable’ trading positions (which fall under a position size) indicates that small traders usually account for about 20% of the volume in most markets, a reasonable proxy for retail participation.
Clearly, institutions take a leading role in nearly every major financial market. Nonetheless, FX and bonds stand out for the outsized influence of smart money in these asset classes. Regardless, retail’s minority share in every market underscores the importance of understanding smart money concepts.
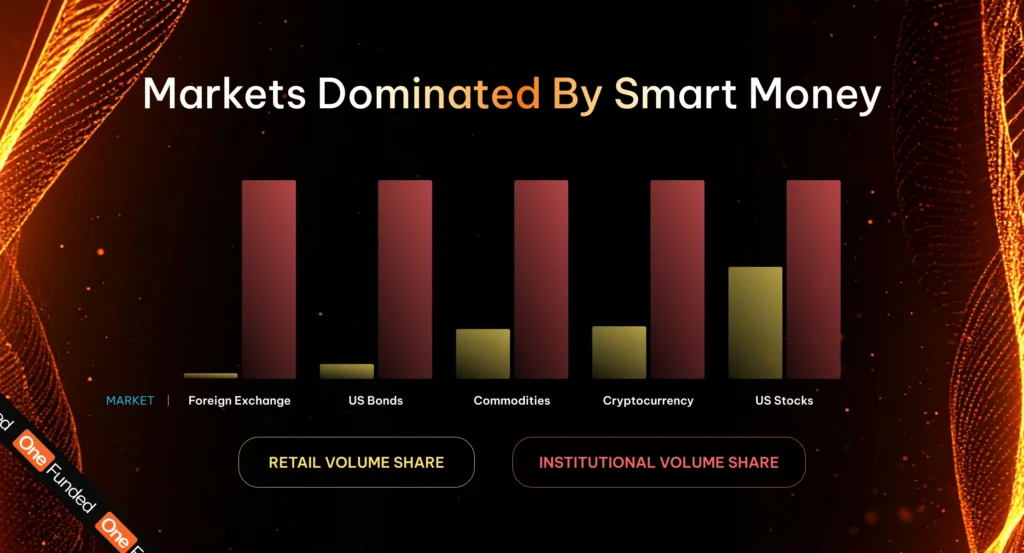
| Market | Retail Volume Share | Institutional Volume Share |
| Foreign Exchange | 2,5% | 97,5% |
| US Bonds | 7% | 93% |
| Commodities | 20% | 80% |
| Cryptocurrency | 21% | 79% |
| US Stocks | 36% | 64% |
Analyzing Activity for Smart Money Behavior
In this section, we’ll begin uncovering evidence of institutional trading in practice. Smart money trades often leave recognizable, repeatable patterns in order flow data.
Smart money trading activity can often drive bullish or bearish price trends. To capitalize on those trends, traders need to learn how to identify smart money activity when it occurs. In this section, we’ll discuss four major smart money patterns and why they appear, along with several smaller patterns worth mentioning.
In order to detect some of these patterns, traders may only need basic candlestick charts and historical volume indicators. But to detect others, they’ll need access to level 2 order data. Since some platforms charge a separate subscription fee to access level 2 data, it’s important for traders to understand what tools they have access to when identifying smart money patterns.
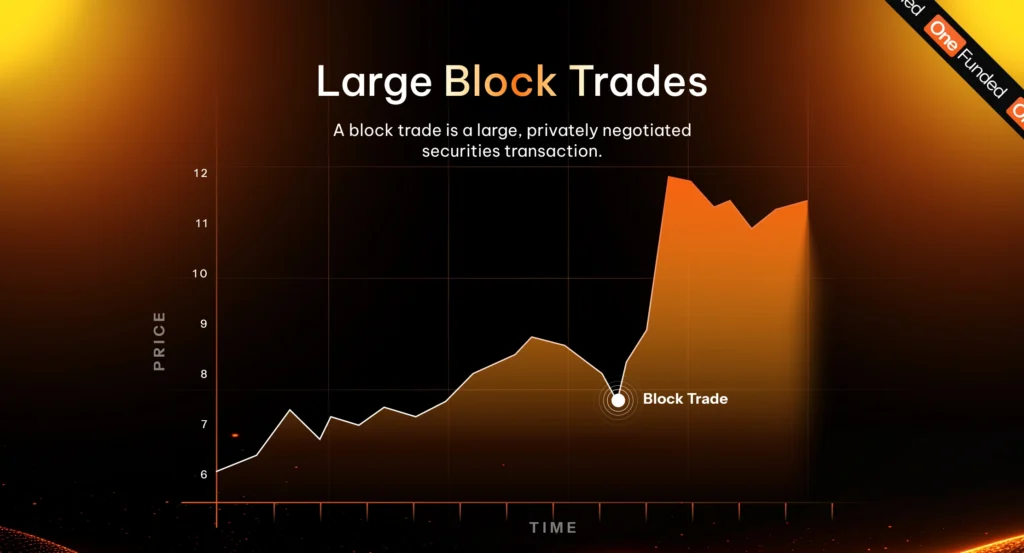
Pattern #1: Large Block Trades
Institutional trades differ from retail trades in several important ways. The first of these is in terms of value; smart money trades are typically far larger than those placed by individuals. But the second is in terms of quantity; institutional portfolio managers typically prefer to operate in round blocks, such as 10,000 units of an asset.
As a result, large block trades can sometimes be evidence of institutional activity. Due to the way in which candlestick charts group order activity within a given period, it can be challenging to isolate the effects of a single trade. Nonetheless, a lone candlestick with a significant volume spike could be evidence of a large block trade. For instance, if 30-second candles for an asset have an average volume of 500 units, but the volume on one candle spikes to 20,000 units, it might be an indicator of institutional activity.
It’s also important to look for repeating patterns of large block trades. Traders at hedge funds and banks often prefer to break large orders up into smaller chunks to allow liquidity providers to repopulate the order book and avoid moving prices dramatically. For example, if you spot a repeated volume spike at the top of every hour, that could be evidence of a systematic order strategy employed by a smart money trader to conceal the size of their overall position.
Importantly, the relevance of block trades is tied to the resulting price impacts. If a large volume spike is followed by a consistent price trend, that pattern could indicate that smart money is forcing market makers to adjust. On the other hand, a one-off spike followed by no discernible trend could mean that market makers were able to absorb the above-average order without moving prices.
Pattern #2: Imbalance Gaps
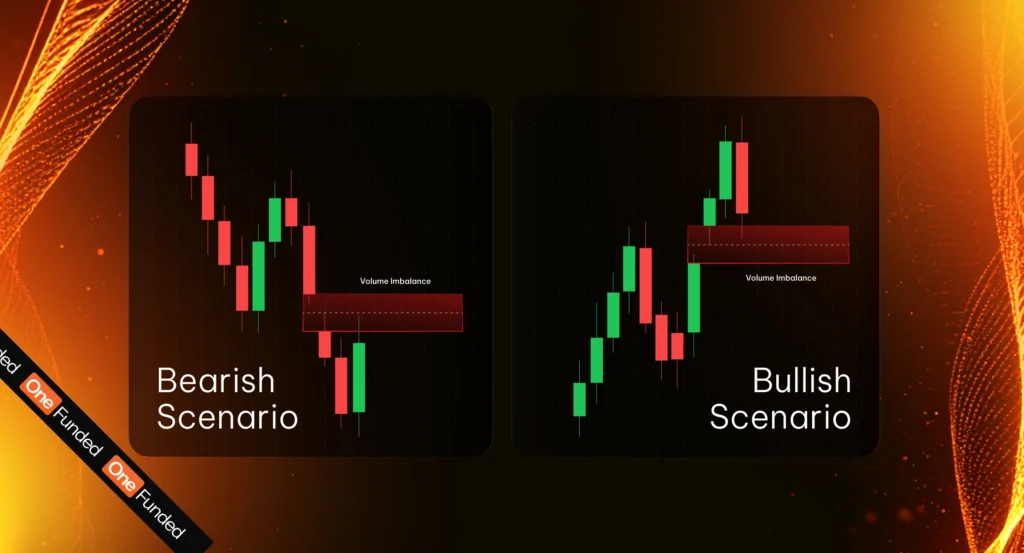
As the name suggests, imbalance gaps occur when either buyers or sellers dominate the total volume of executed orders in a given period. One of the easiest ways to detect an imbalance is with indicators like volume delta, which shows the ratio of market buy to market sell orders in a given candle. If several imbalance gaps occur in multiple subsequent candles, it could be an indication of smart money trading in a particular direction.
Importantly, imbalance gaps usually aren’t enough on their own to identify institutional activity. These gaps should be confirmed with volume spikes (to confirm that the gaps are associated with block trades) and sustained price behavior (to confirm that market makers are struggling to absorb those block trades without adjusting prices). These institutionally driven imbalance gaps can help traders identify whether existing price trends are being supported or resisted by smart money.
Pattern #3: Liquidity Sweeps
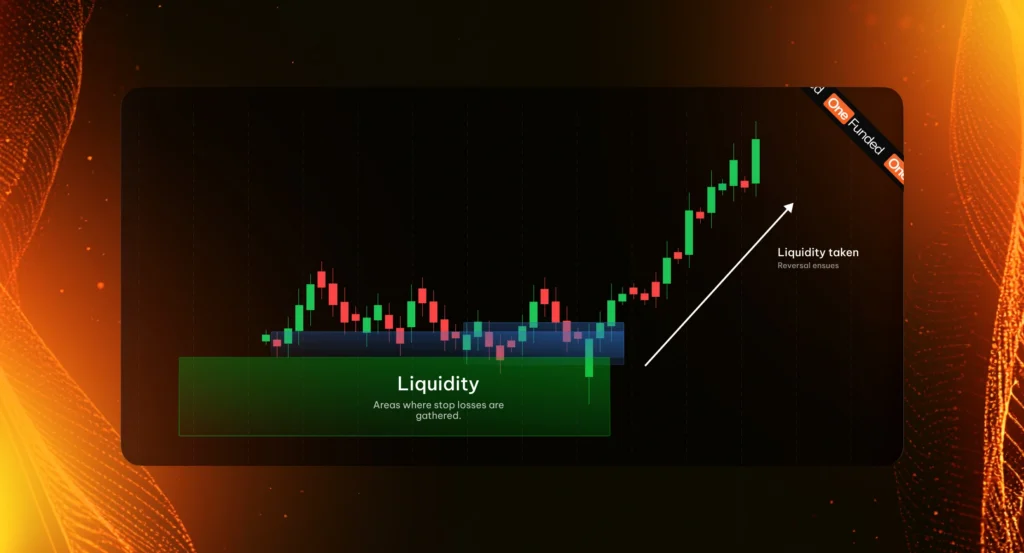
Liquidity sweeps can occur when aggressive trading in one direction clears the order book of a large cluster of limit orders around a particular price. Orders often cluster together as traders establish standing instructions to trade based on resistance or breakout levels. Common stop-loss levels are another popular reason for orders to cluster.
These liquidity sweeps can be identified by analyzing an order book in the immediate wake of a volume spike. Often, such spikes can leave the top of the order book particularly thin in one direction. For example, if an aggressive trader has exhausted an order book of its large ask orders, then subsequent market buys may aggressively climb up the order book.
On the other hand, it’s also possible for market makers to react to volume spikes by repopulating an order book, depending on their balance of inventory. In this case, an order book may not thin out at all. Periods of thin order book liquidity following a major sweep can potentially cause elevated volatility and sharp price changes until liquidity is replenished.
Pattern #4: Aggressive Resting Limits
Throughout this section, we’ve focused on smart money market order behavior. That’s because market orders are largely responsible for driving pricing adjustments in the near term. But as it turns out, smart money limit order behavior can also be surprisingly informative.
Since institutions are aware that market orders can have price impacts, some smart money traders opt to use limit orders instead, even if they’re slower to execute. Institutional limit orders can often be identified by two characteristics: block quantities (e.g., 10,000 shares) made at aggressive prices (often equal to the best bid or ask to prioritize faster execution).
These aggressive resting limits may appear on the order book for brief periods of time, with institutional traders repopulating their orders as they cross with smaller trades. These orders can be highly informative when it comes to understanding how absorptive a market might be in the near term. If an institution is willing to accumulate or dispose of large volumes of inventory around a given price, it can provide strong resistance or support for the market.
Table: Evidence of Smart Money Behavior
| Name | Pattern | Why It Occurs | How to Identify |
|---|---|---|---|
| Large Block Trades | Above-average volume spikes driven by orders with round lots | Institutions place large trades in “block” quantities — for example, 10,000 shares | Historical volume indicators, footprint charts, power trader alerts |
| Imbalance Gaps | When buyers or sellers dominate trading activity in a short period of time | Smart money overwhelms smaller traders by seeking to quickly establish a position | Volume delta and other imbalance indicators |
| Liquidity Sweeps | When a natural cluster of liquidity is wiped out by a large trade sweeping orders off the book | Institutional trades are drawn to liquidity clusters as smart money market orders seek to cross with outstanding limit orders | Real-time order book data in the wake of a volume spike |
| Aggressive Resting Limits | Large block trades sitting at the top of either side of an order book that are consistently refilled | Institutional traders seek to build or dispose of a position through limit orders rather than market orders | Depth of market indicators, analyzing real-time order book data |
Using Smart Money Concepts Profitably: Practical Tips for Traders
We’ve now discussed how topics like liquidity sweeps and block trades work from an institutional perspective. Now, we’ll see how this knowledge benefits traders in practice. Below, we look at how traders can identify these patterns, analyze them, and potentially use them to enhance their trading framework.
Profiting from Liquidity Sweep Reversals
Large institutional trades often sweep liquidity clusters off the order book. But after this occurs, the price trend tends to reverse, since institutions have successfully acquired the liquidity needed to fill their large positions. Individual traders can potentially profit from these reversals by identifying liquidity clusters ahead of time and entering at the start of the reversal.
Step #1: Mark Key Liquidity Levels
First, traders need to identify potential liquidity clusters where institutional orders are likely to cross. These clusters are often in strong resistance and support areas for an asset, including:
- Equal Highs and Equal Lows: Often appearing as ‘double tops’ or ‘double bottoms,’ these are typically viewed as strong price barriers, with traders placing orders just above or below them.
- Previous Daily Highs and Lows: The highest and lowest price points of the previous trading day are heavily monitored. A break of these levels often triggers a significant amount of resting orders.
- Major Swing Points: These are significant peaks and valleys visible on longer timeframes. Because these levels are so noticeable, they can accumulate a large density of stop-loss orders over time.
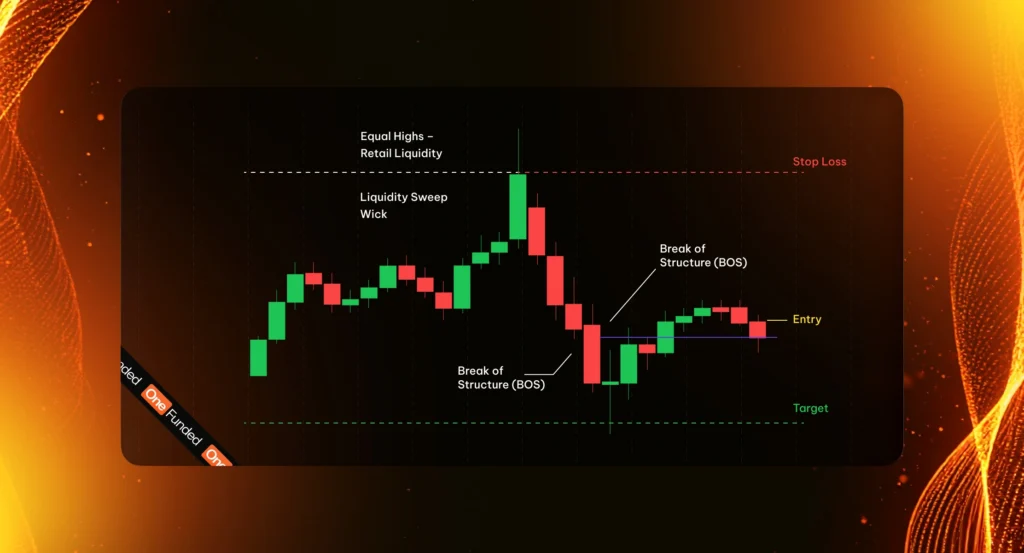
Step #2: Wait for the Sweep and Rejection
Once your levels are marked, patience is vital as you wait for the sweep to occur. The key pattern is seeing price trade aggressively through the level and triggering the pending orders – but failing to sustain the momentum. Look for a candle that pierces the level but closes back inside the previous range, leaving a long wick behind.
Step #3: Confirm Shift in Direction
To avoid false positives, it’s worth ensuring that the sweep was actually driven by smart money. After all, if the liquidity cluster was simply cleared out by regular market activity, there’s no assurance that the shift in direction will be maintained. For instance, a large spike in volume delta over the previous candles can indicate aggressive institutional trading.
Step #4: Enter on the Pullback to the Origin
If the sweep was due to institutional activity, there’s a strong possibility that the price trend will reverse. Since the institution has secured the liquidity necessary to complete their original trade, an aggressive buyer or seller will be removed from the market. Individual traders can profit from this pattern by entering on the reversal, with the price potentially retracing back to the level of the original large move.
Identifying Order Block Support and Resistance
Order blocks represent areas where large institutional orders were executed, leaving behind imbalances that price often returns to fill. These zones can act as powerful support and resistance levels because institutions may have pending orders or unmet demand at these prices. By identifying these zones, traders can use them to help define entry and exit targets, as well as stop-loss levels.
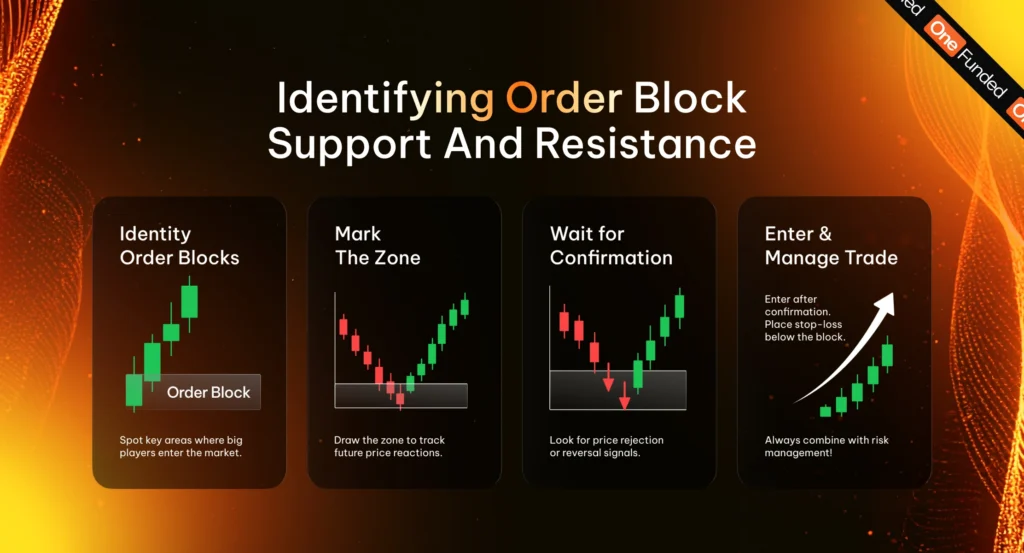
Step #1: Locate Areas of Large Institutional Activity
The first step is to identify price levels with large institutional pressure. Order blocks commonly manifest as candles with high volume that directly precede trending behavior (either bullish or bearish). These candles can be strong indicators of aggressive smart money trading. For traders with access to level 2 data, large resting limits can also be used to identify potential order blocks, although these levels should be verified through previous candles.
Step #2: Draw the Zone
Once order blocks are identified, they can be visually represented as a box on a trader’s chart. For a bullish order block, identify the last down candle before the upward move, drawing a box that covers the entire candle and extending it forward in time. This zone can act as a possible area of support. For bearish blocks, which can act as zones of resistance, identify the last up candle before the downward move.
Step #3: Validate the Zone
Not all order blocks will lead to reliable trading opportunities, so validation is critical. Robust order blocks, which reflect enduring buying and selling pressure from institutional traders, typically demonstrate strong support and resistance. Price should move away from the zone decisively without much hesitation or retesting.
Step #4: Set Entry, Stop, and Targets
Traders can use these validated order blocks to support their existing trading strategy with clear entry and exit levels. For instance, trend traders can wait for a pullback into a bullish order block to join an uptrend. When it comes to setting take-profit levels, they can use a bearish order block as an exit target, winding down trades before they hit institutional resistance. Finally, placing stop-losses beyond these zones can allow for precise risk management, as a confirmed break of the zone signals that the trade setup may be invalid.
Smart Money Concepts: Pros and Cons
As these examples demonstrate, smart money concepts – in coordination with a strong understanding of order flow analysis and volume indicators – can be useful in helping traders understand current trends and likely future patterns. But that doesn’t mean smart money concepts are suitable in every circumstance. In fact, there are distinct pros and cons associated with smart money analysis.
Pros:
- Reflects the reality of financial markets. In every major financial market on earth, institutions drive a substantial amount of all trading activity. The smart money framework reflects that reality by offering traders a guide to identify and understand institutional patterns.
- Can be integrated with an existing strategy. For traders who are happy with their existing strategy, using smart money concepts doesn’t need to mean overhauling their entire market approach. Instead, this type of analysis can be integrated within most other frameworks.
- Focuses on real-time market conditions. Many analytical approaches focus heavily on historical data or past market conditions. In contrast, smart money trading emphasizes the real-time state of markets, which can be more informative when trying to understand where prices might be headed in the near future.
Cons:
- Not suitable for every market and style. Not all markets are equally driven by smart money. In particular, some equity and crypto assets are largely driven by retail activity, so it’s essential that traders understand the character of the market they’re working with. What’s more, long-term trends are typically driven by fundamentals, not portfolio shifts, so smart money analysis is often better suited to intraday trading styles.
- Data can be hard to access. Not only can level 2 market data be expensive, but some markets also have limited order book data in the first place. For example, the forex market has no centralized limit order book. While many FX brokers display their own internal order book, traders might miss institutional activity that takes place elsewhere.
- Analysis can sometimes be misleading. Detecting institutional moves is rarely an exact process, with traders needing to weigh the evidence carefully to determine if certain activity qualifies as ‘smart money.’ Sometimes, this analysis can lead to false positives and misleading conclusions.
As with any other market approach, the key is to understand when using smart money concepts is useful and when it may be a hindrance. Ultimately, only time, experience, and experimentation can allow traders to develop the analytical intuition necessary to confidently assess when and how to apply smart money concepts.
Conclusion: From Smart Money to Profitable Trading

The concept of ‘smart money’ is often distorted in trading circles, treated as a myth of institutions set on extracting profits from retail traders. But as we’ve explored, the reality is far more practical: institutions simply operate with a size and scope that individual traders do not possess. When a sovereign wealth fund or a major bank needs to rebalance their portfolio, the sheer volume of capital forces market makers to react, helping create the trends and volatility that result in daily price action.
As an individual trader, the goal isn’t necessarily to outsmart these institutions, but to use their activity to inform your analysis. By studying order flow and identifying evidence of smart money trading, individual traders can begin to understand the ‘why’ behind major price movements. Whether it’s spotting a large block trade or recognizing a liquidity sweep in real time, understanding these institutional footprints can provide a powerful edge.
Ultimately, smart money analysis is just another trading tool. It does not replace the need for sound risk management and rarely forms the basis of an entire trading strategy. Nonetheless, for individual traders, recognizing the waves created by large institutions can help them stop fighting the current and start riding the wake.