
Why Technical Indicators Matter
Price action alone tells you what the market is doing. Technical indicators tell you how it is doing it – the speed, the momentum, the volatility, and whether the move you are watching has real fuel behind it or is quietly running on empty.
Indicators are mathematical functions applied to historical price (and sometimes volume) data. They do not predict the future, but they help you assess the probability of a continuation or reversal, filter noise from signal, and time your entries and exits with greater precision.
The six indicators covered in this lesson fall into three broad families:
| Family | Indicators | What They Measure |
|---|---|---|
| Trend-Following | SMA, EMA | Direction and strength of the prevailing trend |
| Momentum / Oscillators | MACD, RSI, Stochastic | Speed of price movement; overbought / oversold conditions |
| Volatility | Bollinger Bands | Width of price range; squeeze and expansion cycles |
How to Add Indicators in TradingView
- Open any chart and click the “Indicators” button (the flask icon) in the top toolbar, or press / on your keyboard.
- Search for the indicator by name and click to apply it.
- To adjust settings, click the gear icon ⚙ that appears next to the indicator name on the chart pane.
- To colour-code or toggle visibility, click the eye icon 👁 or the coloured dot next to the name.
- You can stack multiple indicators in the same sub-pane by dragging them onto each other.
Pro tip: Save your favourite combination as a Template (click the Layout icon → Save as Template) so every new chart loads with your full setup instantly.
1. Simple Moving Average (SMA)
What it is
The SMA calculates the arithmetic mean of closing prices over a set number of periods. A 50-period SMA on a daily chart averages the last 50 closing prices. As each new candle closes, the oldest price drops off and the newest is added.
Formula:
SMA(n) = (P1 + P2 + … + Pn) / n
(You don’t need to remember the formula)
Why it matters
The SMA smooths out short-term noise and reveals the underlying trend direction. Institutional traders and funds watch the 50 SMA and 200 SMA religiously – making them self-fulfilling levels of support and resistance.
TradingView setup
- Add “Moving Average” from the Indicators menu.
- Use Length: 50 (medium-term trend) and Length: 200 (long-term trend).
- Set colors: gold for 50 SMA, red for 200 SMA – the market convention.
What to watch for
Golden Cross: The 50 SMA crosses above the 200 SMA → long-term bullish signal. Historically one of the most reliable trend-change confirmations.
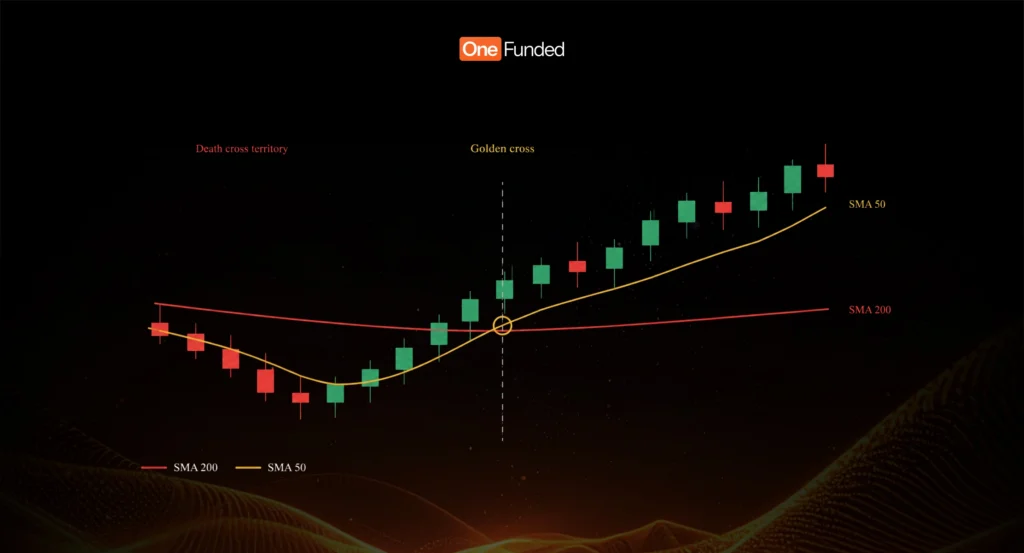
Death Cross: The 50 SMA crosses below the 200 SMA → long-term bearish signal.
Price vs. SMA: Price consistently trading above the 200 SMA = bull market structure. Below = bear market structure.
SMA as Dynamic Support/Resistance: In strong trends, price often bounces off the 20, 50, or 200 SMA. Look for confluence with horizontal S/R levels for high-probability entries.
⚠️ Limitation: SMAs are lagging – they react after price moves, not before. Never use them as a standalone entry trigger on their own.
2. Exponential Moving Average (EMA)
What it is
The EMA is a weighted moving average that gives more importance to recent prices. It reacts faster to new price information than the SMA, making it preferred by short- to medium-term traders.
Key difference: If the last 10 candles printed a sharp move, the EMA will reflect it sooner than the SMA.
TradingView setup
- Add “Moving Average Exponential.”
- Common lengths: 9 EMA (very short-term), 21 EMA (short-term), 50 EMA (medium), 200 EMA (long-term).
- Many swing traders use a 3-EMA ribbon: 9 / 21 / 50 stacked together.
What to watch for
EMA Ribbon Alignment: When 9 EMA > 21 EMA > 50 EMA, the trend is bullish and aligned. When they flip and converge, a reversal or consolidation may be forming.
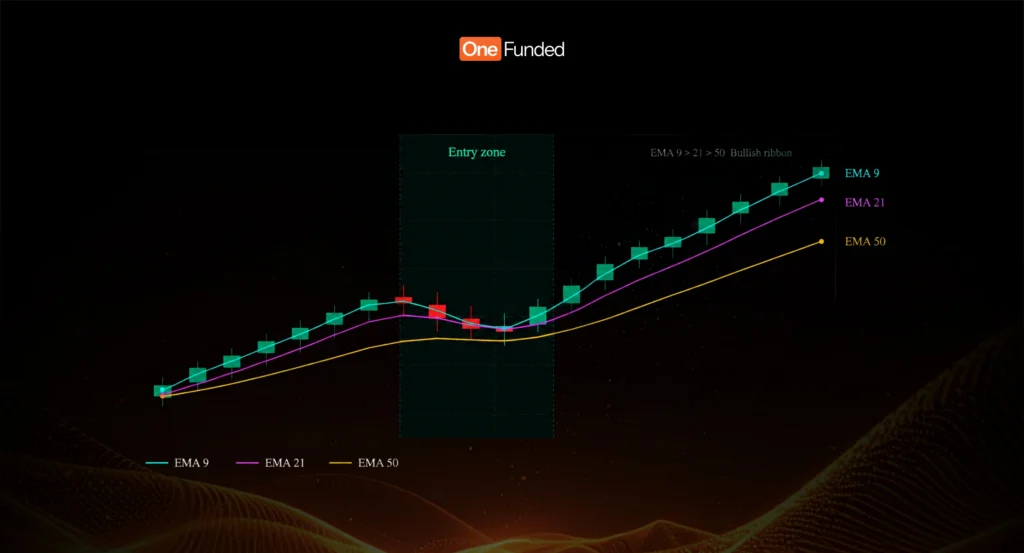
EMA 9 > 21 > 50 = bullish ribbon alignment. Pullback to the 21 EMA in an uptrend is a classic high-probability entry zone.
Price Rejection at EMA: In an uptrend, a pullback to the 21 EMA that forms a bullish candle (hammer, engulfing) is a high-quality entry trigger.
EMA vs. SMA choice: Use EMA when you need faster signals for active trading. Use SMA when you want cleaner, smoother levels for longer-term analysis.
EMA Crossover Strategy (example of a Long):
- Entry: 9 EMA crosses above 21 EMA while price is above 50 EMA.
- Exit: 9 EMA crosses below 21 EMA, or price closes below 50 EMA.
3. MACD (Moving Average Convergence Divergence)
What it is
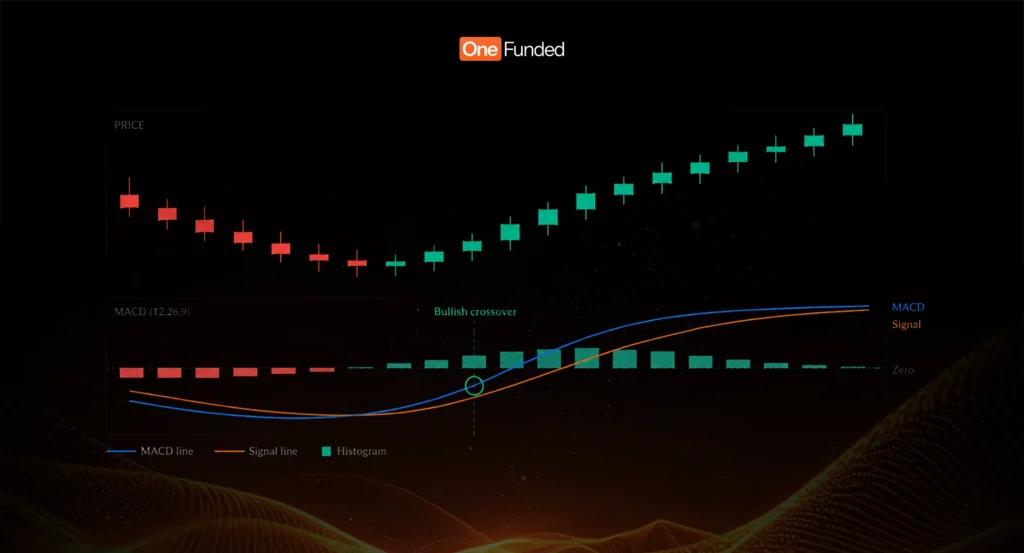
The MACD measures the relationship between two EMAs — typically the 12-period and 26-period — and plots the difference as the MACD line. A 9-period EMA of the MACD line is then plotted as the Signal line. The difference between these two is shown as a histogram.
Components:
- MACD Line = 12 EMA − 26 EMA
- Signal Line = 9 EMA of MACD Line
- Histogram = MACD Line − Signal Line
TradingView setup
- Add “MACD” (default settings: 12 / 26 / 9 are standard).
- Make the histogram bars green when positive, red when negative for easy reading.
- The indicator will appear in a separate sub-pane below the price chart.
What to watch for
Signal Line Crossover:
- MACD line crosses above the Signal line → bullish momentum building.
- MACD line crosses below the Signal line → bearish momentum building.
Crossovers that happen below the zero line are stronger bullish signals; above the zero line are stronger bearish signals.
Zero Line Cross:
- MACD crossing above zero = the 12 EMA has surpassed the 26 EMA → trend has shifted bullish.
- MACD crossing below zero = trend has shifted bearish.
Histogram momentum:
- Histogram bars growing larger = momentum is increasing.
Histogram bars shrinking = momentum is fading, potential reversal or pause ahead.
4. RSI (Relative Strength Index)
What it is
The RSI measures the speed and magnitude of price changes on a scale of 0 to 100. It compares the average size of recent gains to recent losses over a default period of 14 candles.
Formula (simplified):
RSI = 100 – [100 / (1 + RS)]
RS = Average Gain / Average Loss (over 14 periods)
TradingView setup
- Add “Relative Strength Index.”
- Default length: 14 (standard across all timeframes).
- Add horizontal lines at 70 (overbought) and 30 (oversold).
- Optional: add lines at 60 and 40 for trend confirmation (see below).
What to watch for
Overbought / Oversold:
- RSI above 70 = overbought → potential for pullback or reversal.
- RSI below 30 = oversold → potential for bounce or reversal.
- In strong trends, RSI can remain in overbought/oversold territory for extended periods — do not use these levels as automatic entry signals in isolation.
RSI 50 Midline:
- RSI consistently above 50 = bulls in control.
- RSI consistently below 50 = bears in control.
- A break of the 50 line during a trend is an early warning of a potential shift.
RSI Trend Zones (advanced):
- In bull markets, RSI tends to oscillate between 40 and 80 (bullish zone).
- In bear markets, RSI oscillates between 20 and 60 (bearish zone).
- Breakout from these zones often precedes trend changes.
RSI Divergence The Art of Catching Reversals Early
Divergence is one of the most powerful concepts in technical analysis. It occurs when price and a momentum indicator move in opposite directions — signaling that the underlying strength of the move is weakening even before price reverses.
Types of Divergence
1. Regular (Classic) Divergence — Reversal Signal
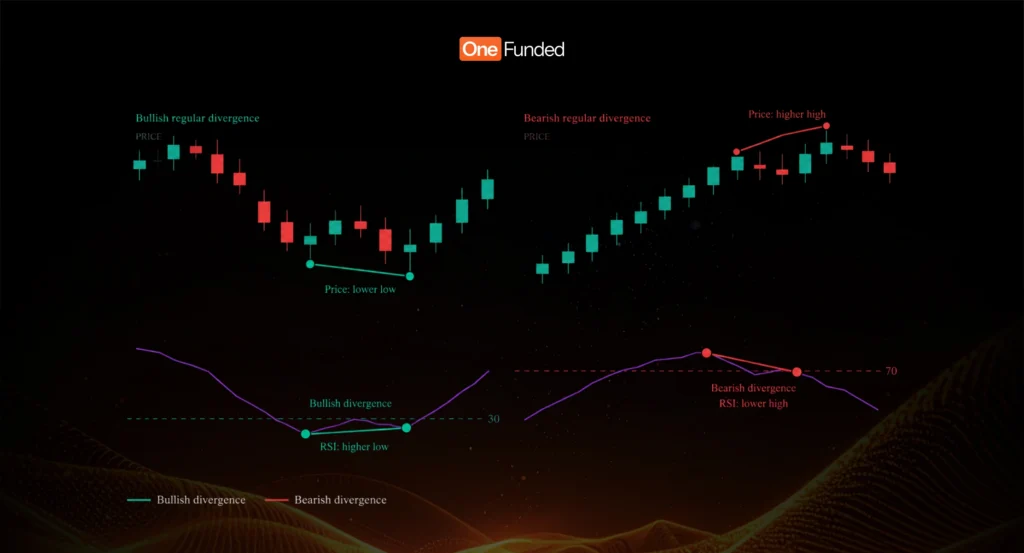
Bearish Regular Divergence: Price makes a Higher High → Indicator makes a Lower High → Momentum is weakening at the top. A reversal to the downside is likely.
Bullish Regular Divergence: Price makes a Lower Low → Indicator makes a Higher Low → Selling pressure is drying up. A reversal to the upside is likely.
2. Hidden Divergence — Continuation Signal
Bullish Hidden Divergence: Price makes a Higher Low (uptrend pullback) → Indicator makes a Lower Low → The pullback looks weak in momentum; the uptrend is likely to continue.
Bearish Hidden Divergence: Price makes a Lower High (downtrend rebound) → Indicator makes a Higher High → The bounce is losing steam; the downtrend is likely to resume.
- This is where RSI becomes most powerful as a reversal signal.
RSI Failure Swings: An RSI failure swing occurs when RSI:
- Enters overbought (>70), then
- Drops back below 70, then
- Rallies but fails to re-enter overbought territory, then
- Breaks its prior low. This is a standalone bearish reversal signal that does not even require comparison to price.
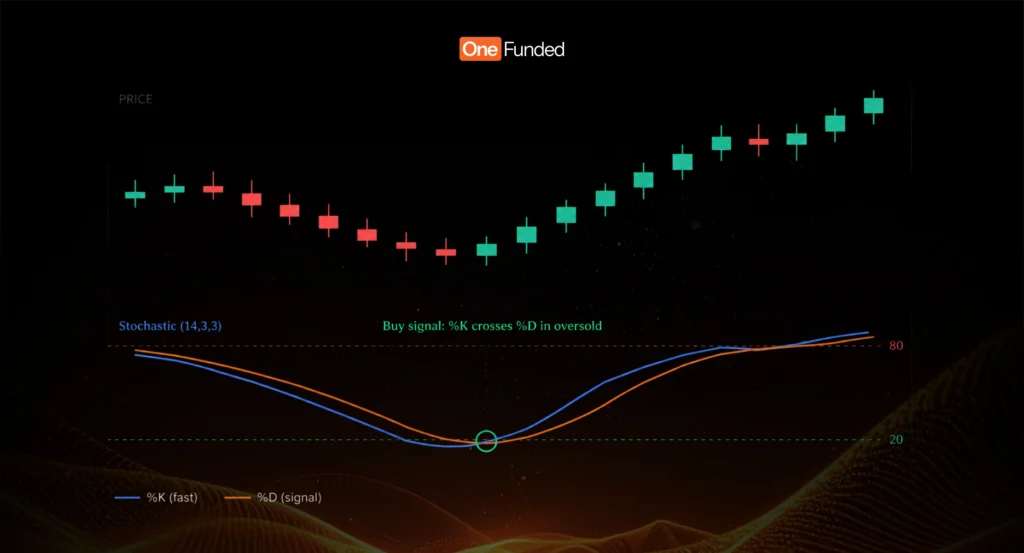
5. Stochastic Oscillator
What it is
The Stochastic compares a security’s closing price to its price range over a given period. It outputs two lines:
- %K line (fast): the raw stochastic value.
- %D line (slow): a 3-period SMA of %K — acts as the signal line.
Formula:
%K = [(Close – Lowest Low) / (Highest High – Lowest Low)] × 100
Default settings: 14, 3, 3 (lookback, %K smoothing, %D smoothing)
TradingView setup
- Add “Stochastic.”
- Default: 14 / 3 / 3.
- Add horizontal lines at 80 (overbought) and 20 (oversold).
What to watch for
Overbought / Oversold Zones:
- Stochastic above 80 = overbought.
- Stochastic below 20 = oversold.
- These are more reliable for mean-reversion trades in ranging markets; in strong trends, expect extended stays above/below these levels.
%K / %D Crossover:
- %K crosses above %D inside the oversold zone (<20) → bullish entry signal.
- %K crosses below %D inside the overbought zone (>80) → bearish entry signal.
- Crossovers outside the extreme zones are weaker and should be filtered with other confluence.
Stochastic vs. RSI:
- Stochastic is better for ranging/choppy markets (faster, more reactive).
- RSI is better for trending markets (more accurate trend-state assessment).
- Use both together for confirmation.
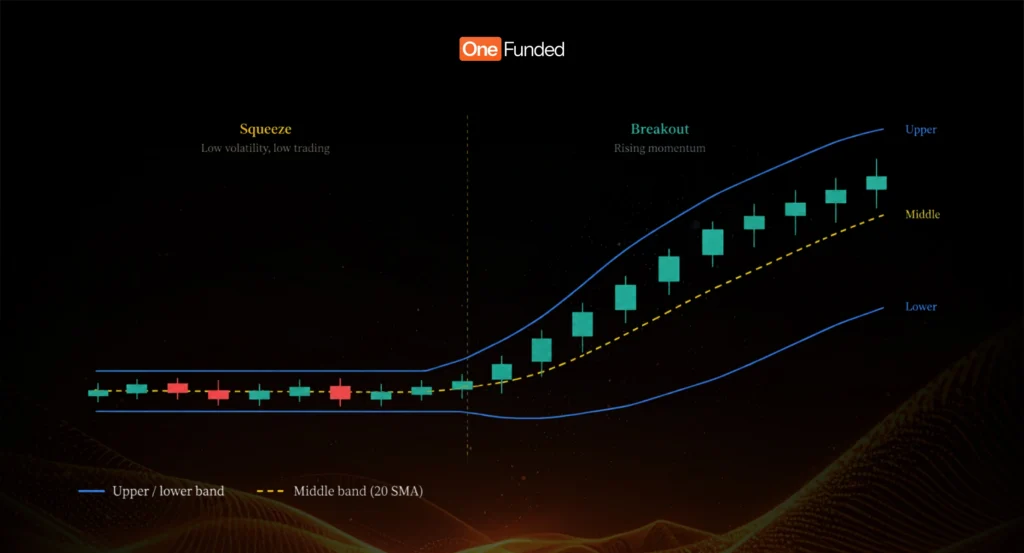
6. Bollinger Bands
What it is
Bollinger Bands consist of three lines plotted around price:
- Middle Band: 20-period SMA.
- Upper Band: Middle Band + 2 standard deviations.
- Lower Band: Middle Band − 2 standard deviations.
The bands automatically widen in volatile conditions and narrow in quiet conditions. Statistically, approximately 95% of price action falls within the bands at any given time.
TradingView setup
- Add “Bollinger Bands.”
- Default settings: Length 20, StdDev 2.
- Make the middle band a distinct color (e.g., blue) so it reads as a standalone MA.
What to watch for
Bollinger Band Squeeze:
- When the bands become very narrow (volatility contracts), a significant price expansion is imminent — in eitherdirection.
- This is one of the best setups for breakout traders. Wait for the squeeze, then enter on the confirmed breakout candle.
- On TradingView, add the “Bollinger Bands Width” sub-indicator to quantify and alert on squeezes.
Band Walk:
- In a strong uptrend, price can “walk” along the upper band for many candles. This is a sign of strength, not overbought.
- Conversely, a walk along the lower band signals strong selling pressure.
- Only trade mean-reversion if the band walk ends with a clear close back inside the bands.
Mean Reversion:
- Price touching or briefly piercing the outer band and then reversing with a strong candle = potential fade/reversal trade.
- Most powerful when combined with RSI at 70/30 extremes simultaneously.
Middle Band as Support / Resistance:
- In trends, the 20 SMA middle band acts as dynamic support/resistance similar to the 21 EMA.
- A clean bounce off the middle band with bullish/bearish confirmation is a trend-continuation entry.
Putting It All Together: A Complete Indicator Stack
Below is a professional example of how to combine all six indicators into one coherent trading framework.
Example: Identifying a High-Probability Long Entry
Scenario: Daily chart, uptrend in place.
Step 1 — Trend Confirmation (EMA/SMA) Price is above the 50 EMA and 200 SMA. Both moving averages are pointing upward and separated (not converging). Trend is confirmed bullish.
Step 2 — Pullback to Value (EMA / Bollinger Band middle) Price has pulled back to the 21 EMA, which coincides with the Bollinger Band middle band. This is the “value zone” in an uptrend.
Step 3 — Oversold Reading (RSI / Stochastic) RSI has dipped to 42 (not extreme but closer to 40-zone support). Stochastic %K has reached 18 (oversold) and is beginning to curl upward, with %K crossing above %D.
Step 4 — MACD Confirmation MACD histogram has transitioned from red to green. MACD line is crossing above the signal line below the zero line (high-quality bullish crossover).
Step 5 — Bollinger Band context The bands are not in a squeeze (normal width), suggesting the trend is alive. Price is near the middle band, not the lower band, confirming this is a controlled pullback, not a panic sell.
Result: All six indicators align bullishly. Entry is taken on a bullish confirmation candle (e.g., a hammer or bullish engulfing) at the 21 EMA, stop-loss below the recent swing low, target at the previous high.
Common Mistakes to Avoid
1. Indicator Overload Using 8+ indicators simultaneously creates analysis paralysis and contradictory signals. Stick to 3 – 4 complementary tools that cover trend, momentum, and volatility, not 4 momentum oscillators saying the same thing.
2. Treating Indicators as Predictors Indicators describe what has happened, not what will happen. They are evidence to weigh, not oracles to obey.
3. Ignoring the Trend When Trading Oscillators RSI at 30 means very little in a strong downtrend — the market can stay oversold for a long time. Always qualify oscillator signals with the higher-timeframe trend.
4. Acting on Divergence Without Confirmation Divergence can develop and persist for many candles before price reacts. Always wait for a price structure confirmation (trendline break, candle pattern, indicator crossover) before entering.
5. Optimizing Indicators to Historical Data (Curve Fitting) Tweaking settings until they perfectly match past price action guarantees they will fail on future data. Use standard, widely-accepted settings so your levels align with how the majority of market participants are reading the chart.