Fibonacci retracement is one of the most misunderstood tools in trading. Most traders draw it and stare at the lines hoping price will bounce. The traders who actually use it profitably understand that the levels are only meaningful when they tell you where in a move you are — and whether the price you are paying is cheap or expensive relative to the full range.
What Is the Fibonacci Retracement?
The Fibonacci sequence is a series of numbers where each number is the sum of the two before it: 0, 1, 1, 2, 3, 5, 8, 13, 21, 34… The ratios between these numbers — particularly 0.618, 0.382, and 0.236— appear repeatedly in nature, architecture, and financial markets. Whether you believe markets are governed by mathematics or simply that enough traders watch these levels to make them self-fulfilling, the practical result is the same: price respects Fibonacci levels with notable consistency.
In trading, the Fibonacci retracement tool is used to identify potential areas of support or resistance within a pullback. After a significant price move, up or down, price rarely continues in a straight line. It retraces. The Fibonacci levels help you anticipate where that retracement is likely to pause or reverse before the original move continues.
📐 THE CORE IDEA
Fibonacci retracement measures how much of a prior move price has given back. A retracement to the 0.5 level means price has pulled back exactly halfway. A retracement to 0.618 means price has given back 61.8% of the original move. These are the zones where continuation traders look to get involved.
How to Draw the Fibonacci Retracement
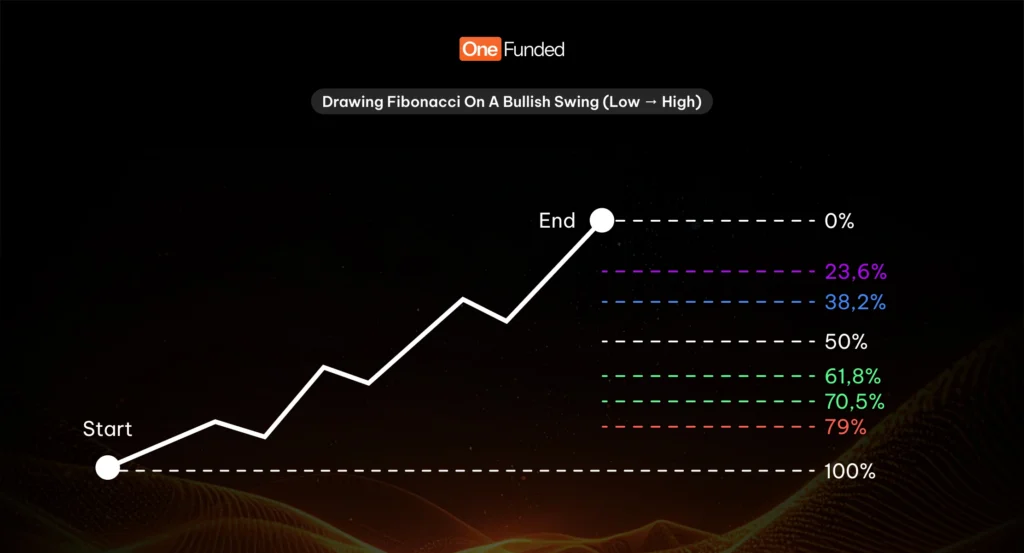
The most important thing to understand before drawing Fibonacci is this: you are always drawing from the origin of the move to the end of the move. The direction you draw determines everything.
- Identify a significant swing move. Look for a clear, impulsive price move on your chosen timeframe — a strong rally in an uptrend, or a sharp selloff in a downtrend. The move should be obvious and meaningful, not a minor wiggle within a range.
- In an uptrend: draw from the swing low to the swing high. Anchor your tool at the base of the move (the swing low) and drag it up to the top of the move (the swing high). The Fibonacci levels will now plot between these two points as the retracement zones to watch on the pullback.
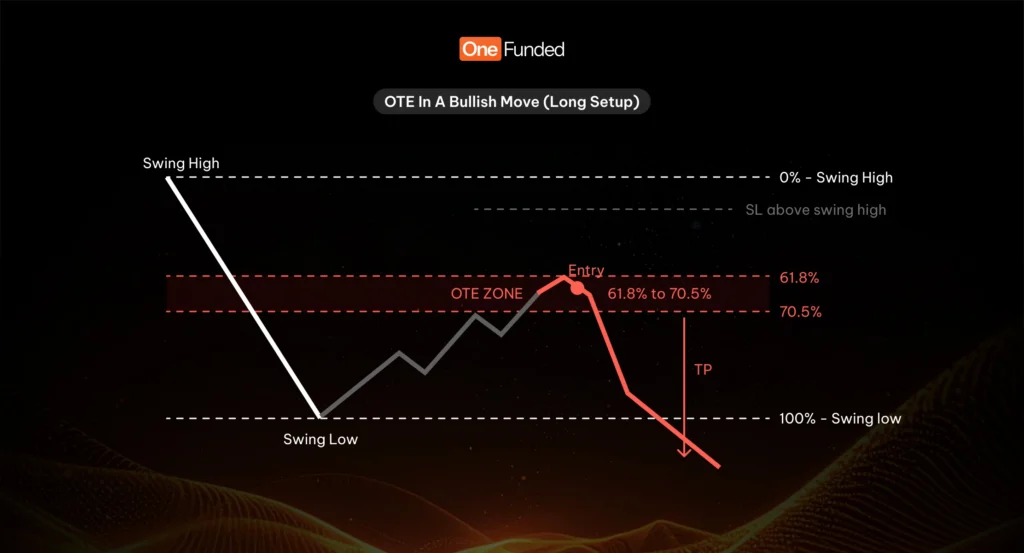
- In a downtrend: draw from the swing high to the swing low. Anchor at the top of the move (swing high) and drag down to the bottom (swing low). The retracement levels now mark where a counter-trend bounce may stall before price continues lower.
- Wait for price to retrace into the levels. Once drawn, do nothing until price pulls back into the Fibonacci zone you are watching. The levels are areas of interest — not automatic entry signals. You need additional confluence at the level before acting.
The Key Fibonacci Levels — What Each One Means
Not all Fibonacci levels are equal. Some are minor reference points; others are the most watched levels in all of technical analysis. Here is what each level means in practice.
| Level | Significance | Notes |
|---|---|---|
| 0.236 / 23.6% | Shallow retracement | Very minor pullback. Only valid in extremely strong trends. Rarely used as a standalone entry level. |
| 0.382 / 38.2% | Moderate retracement | Watched in strong trends where price barely pulls back. A bounce here signals powerful momentum still present. |
| 0.50 / 50% | Equilibrium — midpoint | Not a true Fibonacci number but one of the most respected levels. The exact halfway point of the move. The dividing line between discount and premium zones. |
| 0.618 / 61.8% | The Golden Ratio | The single most important Fibonacci level. Known as the “golden ratio” — appears throughout nature and markets. The 0.618 retracement is where the highest-probability continuation setups form. |
| 0.705 / 70.5% | OTE zone boundary | Used alongside 0.618 to define the Optimal Trade Entry zone. Not a classic Fibonacci number but widely used in modern trading methodology. |
| 0.79 / 79% | Deep retracement warning | A retracement this deep begins to question whether the original move is still valid. If price pulls back beyond 0.79, the trend structure may be breaking down. Used as a soft invalidation boundary. |
| 1.0 / 100% | Full retracement | Price has returned entirely to the origin of the move. A break beyond this level is a full reversal of the swing — structure has shifted. |
Discount & Premium Zones
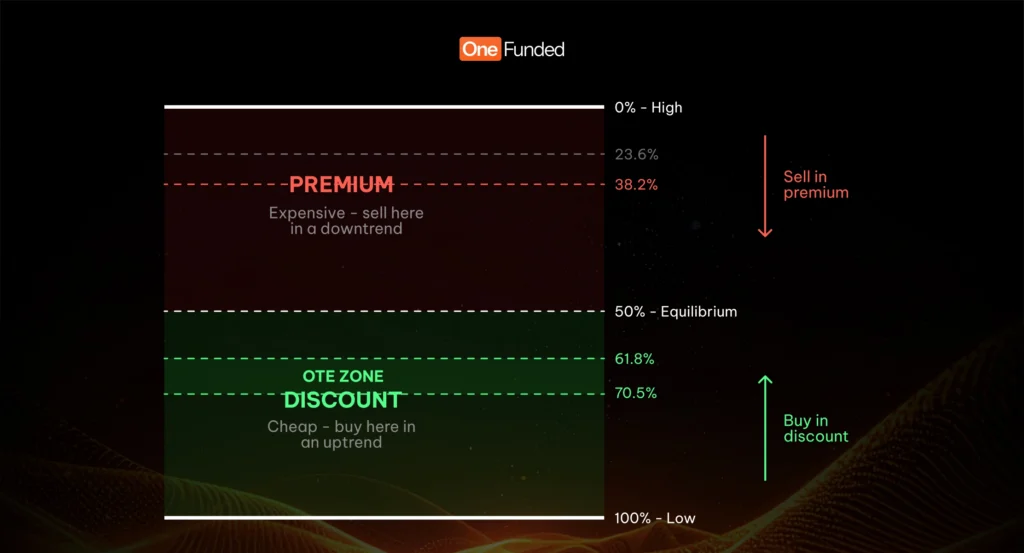
This is one of the most elegant and practical concepts in all of technical analysis – and it flows directly from the Fibonacci tool. Once you draw your retracement across a move, the 50% level becomes your dividing line. Everything above it is expensive. Everything below it is cheap.
The Core Principle
Think of it like buying anything in real life. If a product normally sells for £100 and you can buy it for £40, that is a discount – you are getting value. If you are paying £80 for it, that is a premium – you are paying above the midpoint. Markets work the same way. When price pulls back below the 50% level of a bullish move, it is trading at a discount to that full range. When price retraces above the 50% level in a bearish move, it is trading at a premium.
The principle: in an uptrend, you want to buy at a discount. In a downtrend, you want to sell at a premium. You are always looking to buy cheap and sell expensive, relative to the most recent significant move.
THE MISTAKE TO AVOID:
Never buy in the premium zone in an uptrend because you think price “looks strong.” You are paying above equilibrium for an asset that has already rallied significantly. Equally, never sell in the discount zone of a downtrend because it “looks weak.” Wait. Let price come to you at the level that gives you value – not the level that feels comfortable because everyone else is already in the trade.
The Optimal Trade Entry (OTE)
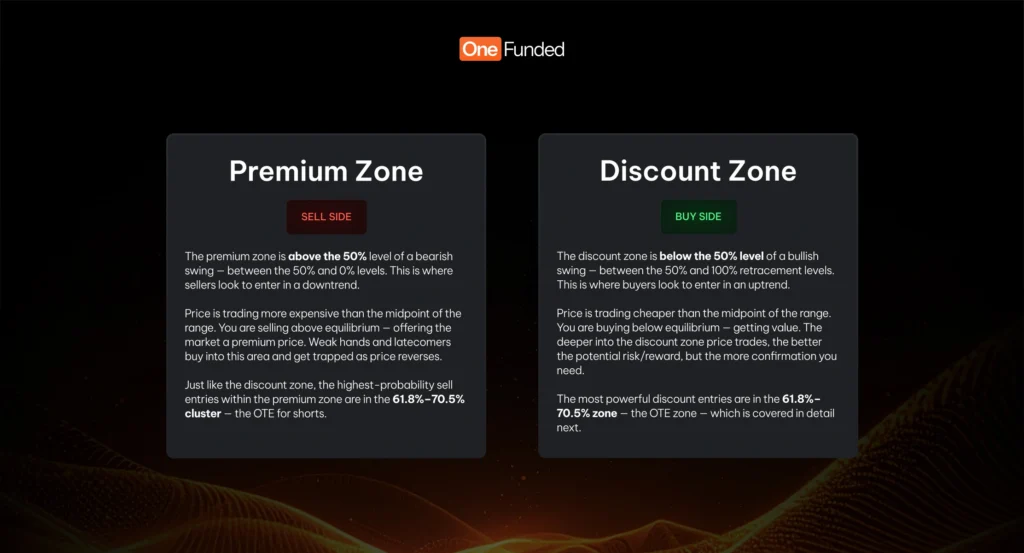
The Optimal Trade Entry is the name given to the specific Fibonacci zone that offers the highest probability of a successful continuation trade. It is not a single level – it is a cluster of levels between 0.618 and 0.705, sitting deep in the discount zone (for longs) or high in the premium zone (for shorts).
The concept behind the OTE is straightforward: after a significant impulsive move, price will retrace to offer late participants a second chance to enter. This retracement will often penetrate the 50% level – flushing out weak hands – and drive deep into the 0.618–0.705 zone before the original direction resumes. This deep pullback is not a sign of weakness. It is the market creating value – lowering the price (in an uptrend) to attract more buyers before the next leg higher.
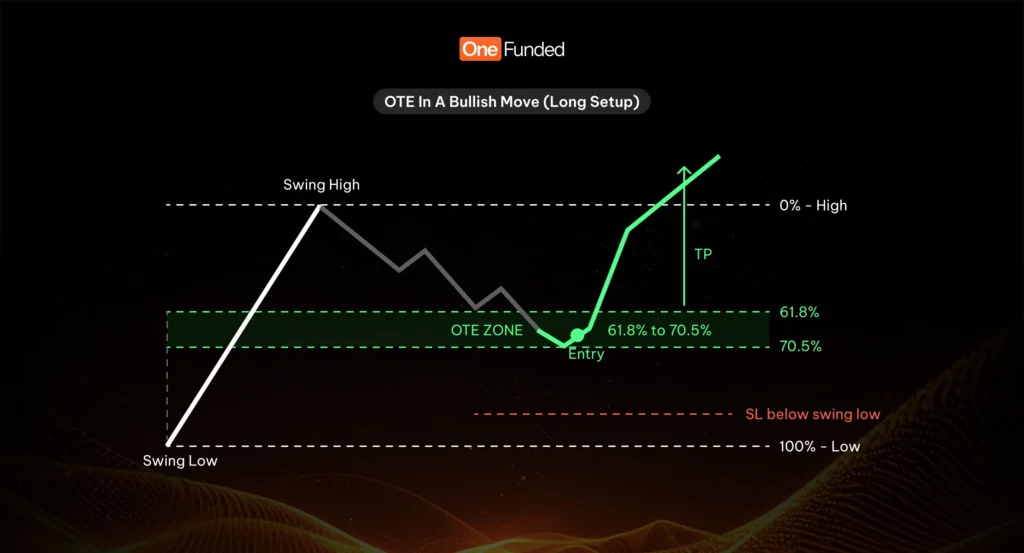
OTE for Longs – Step by Step
- Confirm the higher timeframe is bullish. You are looking for a continuation long entry — the macro trend must support this. Do not look for OTE longs in a bearish market structure.
- Identify a clear bullish impulse swing. Find the most recent impulsive move to the upside — a strong, clean rally from a swing low to a swing high. This is the move you will draw your Fibonacci on.
- Draw Fibonacci from the swing low to the swing high. The 0.618–0.705 zone now marks your OTE – the deep discount area where you are looking for price to retrace into.
- Wait for price to enter the OTE zone. Do not anticipate. Let price come to you. While waiting, look at the zone in context – is there a structural level, a prior support, or a liquidity pool that also sits in this zone? Confluence here dramatically increases probability.
- Look for lower timeframe confirmation. Drop to a lower timeframe when price enters the OTE zone. Look for a Market Structure Shift (MSS) to the upside, a bullish rejection candle, or a reversal pattern forming within the zone. This is your entry trigger – not just the price arriving at the level.
- Stop loss below the 0.79 level or the swing low. Your stop should be placed below the OTE zone — typically at or beyond the 79% level. A move beyond 79% suggests the original swing is breaking down. Do not place your stop directly at the swing low, as liquidity sweeps may spike through it before reversing.
Application on the charts:
What Makes an OTE Setup High Probability
The OTE zone tells you where to look for an entry. It does not tell you to enter blindly the moment price touches 0.618. The difference between a trader who uses OTE profitably and one who does not is almost always the quality of confluence they require before pulling the trigger.
- Higher Timeframe Structural Alignment. The OTE zone should sit at or near a significant HTF level — a prior swing high/low, an area of value, or a structural support/resistance. When the Fibonacci OTE zone aligns with a market structure level from a higher timeframe, the probability of a reaction increases substantially.
- Trend Direction. Only take OTE longs in bullish structure and OTE shorts in bearish structure. The OTE gives you precision entry — the trend gives you direction. Trading OTE against the trend is low-probability regardless of how perfect the Fibonacci placement looks.
- Liquidity Sweep into the Zone. One of the most powerful OTE setups occurs when price spikes slightly below the 0.618 level — sweeping stop losses placed there — before reversing sharply upward. This sweep-and-reverse at the OTE is a sign that smart money has engineered a move to grab liquidity before continuing in the intended direction.
- Lower Timeframe Market Structure Shift. When price enters the OTE zone, drop to a lower timeframe and look for a clear MSS in the direction of the trade. A bullish MSS forming within the OTE zone of an uptrend is one of the cleanest entry signals available in technical trading.
- Risk/Reward of Minimum 1:3. Because the OTE entry is deep in the discount or premium zone, the stop loss can be tight (below the 0.79 level) while the target is the prior swing high or beyond. This geometry naturally produces favourable risk/reward — if it does not, reassess the swing you have drawn Fibonacci on.
THE FULL SETUP FRAMEWORK
Step 1: HTF is bullish (or bearish for shorts).
Step 2: Identify the most recent impulsive swing.
Step 3: Draw Fibonacci — locate the OTE zone (0.618–0.705).
Step 4: Check whether the OTE zone coincides with a HTF structural level.
Step 5: Wait for price to enter the zone. Look for a liquidity sweep.
Step 6: Drop to LTF — confirm an MSS in the trade direction.
Step 7: Enter. Stop below 0.79 / swing low. Target the prior swing high.
Common Mistakes
- Drawing Fibonacci on insignificant moves. The quality of the setup is directly proportional to the significance of the swing you draw on. A tiny five-candle wiggle on a 5-minute chart produces meaningless OTE levels. Draw on moves that are clear, impulsive, and structurally relevant on your trading timeframe.
- Entering the moment price touches 0.618. The level is a zone of interest, but not an automatic entry. Price may pierce 0.618, sweep a little deeper, and then reverse. Entering immediately on touch without waiting for LTF confirmation leads to premature entries that get stopped out right before the real move begins.
- Using OTE against the trend. A counter-trend OTE setup looks attractive on paper — deep retracement, clean zone, perfect Fibonacci. But you are fighting the dominant order flow. Unless there is a confirmed higher timeframe structural shift, only trade OTE in the direction of the prevailing trend.
- Ignoring what else is at the level. Fibonacci does not exist in isolation. Before entering at an OTE zone, look at what else is there. Is there a prior high that now acts as support? Is there a fair value gap in that area? Is there a round number? The more confluence you find at the OTE zone, the stronger the setup becomes.
Summary
- Fibonacci retracement, discount and premium zones, and the Optimal Trade Entry are three expressions of the same idea: price location matters. Where you enter a trade relative to the full range of a move determines your risk, your reward, and your probability of success.
- Buying in the discount zone means you are buying cheap with room for price to move in your favour before reaching equilibrium, let alone making new highs. Selling in the premium zone means you are selling expensive with natural momentum likely to push price back toward fair value. And the OTE zone, 0.618 to 0.705, is where both principles converge into the single most precise, high-probability entry point that Fibonacci analysis offers.
- Used alongside proper market structure, trend alignment, and lower timeframe confirmation, the OTE framework gives you both the patience to wait for value and the precision to enter with a tight stop and a substantial target. That combination, value-based entries with defined risk, is the foundation of consistent, professional trading.