Market liquidity doesn’t simply appear out of thin air. Instead, it comes from a specific place – limit orders. These limit orders populate the ‘order book,’ which reflects the sizes and prices at which limit traders are willing to transact for a particular asset.
A comprehensive study of order types is outside the scope of this article. Nonetheless, a quick reminder of the two main types of orders will help us dive deeper into the role of market liquidity:
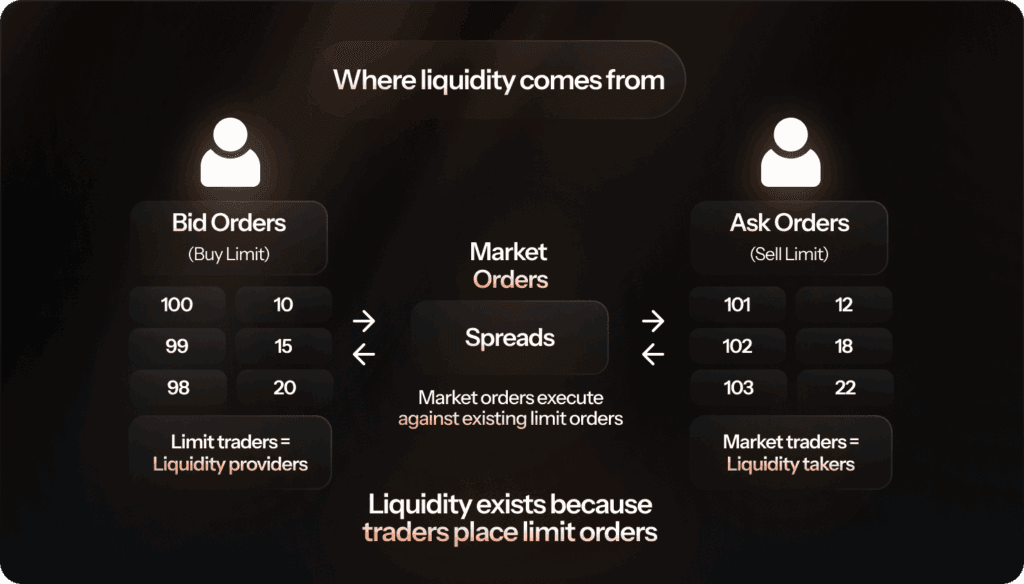
- Market orders – Market orders are placed by traders seeking immediate execution at the current market price. These traders are willing to buy or transact at a specific size but not at a specific price.
- Limit orders – Limit orders are placed by traders who are seeking execution only if an asset reaches a certain price. Limit traders are relatively price-sensitive and willing to sacrifice immediate execution for price certainty.
Market orders and limit orders play fundamentally opposing roles in providing liquidity for a particular asset. In the language of market liquidity, limit traders are referred to as ‘liquidity providers,’ while market traders are considered ‘liquidity takers.’ Some professional traders earn a living providing market liquidity, such as market makers at high-frequency trading firms and dealers at major investment banks.
Limit traders add depth, market traders remove depth
To understand why market and limit orders have opposite impacts on liquidity, consider how the order book for an asset evolves over time. If a trader enters a limit buy order below the current ask price, their order will simply sit on the order book, waiting to be executed. Similarly, a trader entering a limit sell order above the current bid price will also rest on the order book.
Both of these trades add to the ‘depth’ of the market book by increasing the volume of outstanding orders. However, consider what happens if a market trader enters an order to immediately buy at the current best ask price. When this trade crosses with a limit order, that limit order will evaporate from the current book, reducing the depth of the market.
Viewing liquidity as the provision of limit orders on an order book can help us understand why illiquid markets are associated with significant price changes. In illiquid markets, there are few limit orders to absorb incoming market orders. This means that even a relatively small surge of market buys or market sells can burn through all outstanding liquidity around current prices, quickly reaching limit orders on the tail end of the book.
How limit traders can impact resiliency
In the preceding section, we discussed how limit traders contribute to liquidity by adding depth. However, these traders are also responsible for the second component of market liquidity – resiliency. Recall that limit traders are relatively price-sensitive, willing to buy or sell an asset at a particular price. If the asset deviates sharply from this price, limit traders may be willing to step in to ‘correct’ the market by providing more liquidity.
For example, suppose that a limit trader believes a stock should be fundamentally valued between $90 and $100. If a surge in market sell orders ends up driving the price to $80, the limit trader should be willing to quote large blocks of shares for purchase at that price. This increase in demand will help drive the price back up, indicating a resilient market in which price deviations are short-lived.
But in contrast, imagine that this limit trader is not confident in their fundamental valuation of the stock. In this case, the trader may be unwilling to step in to provide liquidity to the market, fearing that the price will stay depressed and they’ll take a loss on their purchase. If limit traders are hesitant to step in, the stock may stay closer to $80 for a longer time, resulting in a less resilient market.
This dynamic also helps explain why liquidity tends to evaporate during periods of risk, volatility, and crisis. During these episodes, price-sensitive traders are far more uncertain about the future state of the world. As a result, they pull back from providing market liquidity, which can lead to prices swinging wildly. This largely characterizes what happened to corporate bond market liquidity during the Covid-19 market crisis, when no one was sure which companies would go bankrupt.
The Impact of Market Liquidity On Your Trades
So far, we’ve discussed market liquidity largely as an abstract concept, looking at how limit traders and market traders interact to create and consume liquidity. With that knowledge, we can now turn to the impact that market liquidity has on your trades in practice. There are four main ways in which market liquidity can affect your trade execution: slippage, price impacts, bid-ask spreads, and partial fills.
Slippage
We’ve seen that liquidity can be determined based on a market’s capacity to absorb trades without moving prices. Slippage is defined as the extent to which this price movement actually occurs. More specifically, slippage refers to the difference between a trader’s expected execution price and their realized execution price.
For example, suppose that a highly liquid blue-chip stock like Apple currently trades at a best ask price of $250. A market trader looking to acquire Apple shares enters a buy order. This order executes at exactly $250, resulting in zero slippage – the expected price was the executed price.
Now, suppose that the stock trading at $250 is the relatively illiquid shares of a regional electronics distributor. In this case, by the time a market buy order is executed, the best ask price may have swung to $250.50 – the trader ended up paying more than they expected for their shares. While 50¢ might not seem like a huge amount of slippage, this amount can potentially be multiplied by a significant volume of shares, depending on the size of the order.
The key insight here is that, by definition, illiquid assets tend to swing more in response to a surge in orders than liquid assets. This can result in a greater level of volatility, especially in less-resilient markets. As a result, traders are more likely to experience slippage in illiquid assets, which can potentially impair trading profits.
Price impacts
Slippage has to do with the way that other people’s orders impact a trader’s realized price. Price impacts are a closely related phenomenon, capturing the way that an individual order can impact its own execution price. This dynamic is closely related to the depth of a limit order book.
Suppose that an order book currently has 3 limit sell orders on it: 100 units at $100, 100 units at $105, and 100 units at $110. Now imagine that a market trader enters the picture, seeking to purchase 300 units of the asset. If the trader only looks at the best ask price for the asset, they’ll see a price of $100.
However, when the trader actually goes to execute the order, the $100 limit order has an insufficient quantity to completely satisfy the market order. As a result, the market trader’s order will ‘crawl up’ the order book, executing against the $105 and $110 orders as well. The final realized execution price will actually be 300 units at an average of $105, not $100.
This $5 gap had nothing to do with external factors like market volatility or other traders’ orders. Instead, the order managed to affect its execution price entirely on its own. When price impacts occur in conjunction with slippage, they can potentially result in surprisingly adverse pricing for traders with large-volume orders.
Bid-ask spreads
The impact of bid-ask spreads on trade execution is relatively unique compared to other liquidity factors. Unlike slippage and price impacts, widening bid-ask spreads don’t result in adverse trade execution directly. Instead, they make it more expensive to trade, indirectly impairing profitable opportunities.
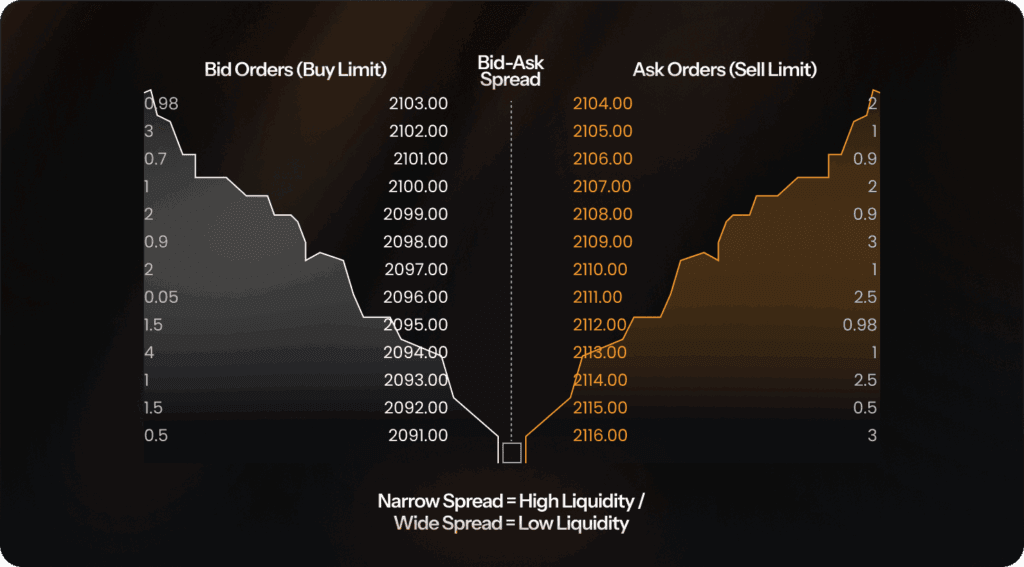
In order to execute market orders, traders need to ‘cross the spread’ – meaning buying at the (higher) ask price and selling at the (lower) bid price. As liquidity providers, limit traders do not need to pay this trading cost. In illiquid markets, market traders end up paying a higher price to execute trades.
Stock market liquidity for major shares, for instance, tends to be quite deep. That results in narrow bid-ask spreads and thus low trading costs. But crypto market liquidity for niche tokens can sometimes be quite shallow, which can result in reduced profitability for short-term trading styles as a result of wider bid-ask spreads.
Partial fills
Sometimes, markets can be so illiquid that traders cannot execute their desired order at any price. This can result in a partial fill. As the name suggests, this phenomenon occurs when a trader’s order is only partially filled, such as acquiring just 50 out of a desired 100 shares.
While partial fills are rare in mainstream asset classes, they can occur in niche assets that may not have professional liquidity providers. Crypto market liquidity and forex market liquidity, for example, can be so shallow in exotic tokens or currency pairs that order books do not contain a sufficient quantity of limit orders for market traders to execute against.
Real-World Liquidity Patterns: How Liquidity Shapes Financial Markets
Liquidity formation isn’t simply a matter of limit traders randomly deciding to enter and exit the market. In fact, financial markets see several consistent real-world patterns that shape available liquidity. Understanding these patterns can not only help traders understand how liquidity takes shape, but also when interacting with key markets can be the most beneficial.
Pattern #1: The New York-London forex overlap
London is widely considered the global leader in the forex market, home to many of the world’s leading currency-focused banks, traders, and funds. That means London business hours are often some of the most liquid hours for the forex market. But London is far from the only forex-focused city, with New York also playing a leading role.
That’s significant, since New York and London share a roughly four-hour overlap during the business day. 8AM – 12PM New York Time is 1PM – 5PM London. This four-hour block comprises a significant portion of global forex activity, with some estimates indicating that roughly half of all daily forex trades occur during this window. As a result, trading the New York-London overlap can be a valuable approach for traders with a strategy that depends on ample liquidity.
Pattern #2: The August effect
The ‘August effect’ is a regular phenomenon in many markets that refers to a persistent low level of liquidity during the month of August. The reason is simple: many traders and money managers are on vacation during the summer. Without these professionals at their desks in August, market liquidity can often dry up.
Ironically, this pattern can potentially make it more valuable for traders to consider taking their own vacation in August. Since there isn’t much volume in the market, traders may not be missing out on many opportunities by taking August off. For traders who continue through the summer, being aware that spreads may be wider and prices more volatile can help manage risk.
Pattern #3: Trading near the bells in the stock market
Major stock exchanges are generally open during business hours (in the case of the New York Stock Exchange, 9:30AM-4PM New York time). However, liquidity is not evenly distributed throughout these hours. Instead, liquidity tends to cluster ‘near the bells,’ with the majority of trades occurring just after 9:30AM and just before 4PM.
This pattern is no accident. Opening trades often occur as traders digest the previous day’s news and establish their daily positions. Meanwhile, closing trades are typically the result of funds repositioning to track their benchmarks (which are typically determined based on closing prices) and traders liquidating any outstanding positions (to avoid bearing overnight risk).
How to Track Market Liquidity: Tools, Statistics, and Indicators
In order to incorporate liquidity effects into your trading strategy, it’s essential to understand how to track market liquidity. There are several different approaches to measuring liquidity, each of which has unique benefits and trade-offs. The three main categories include volume-based indicators, metrics based on the order book and bid-ask spread, and advanced quantitative statistics.
Category #1: Volume-based indicators
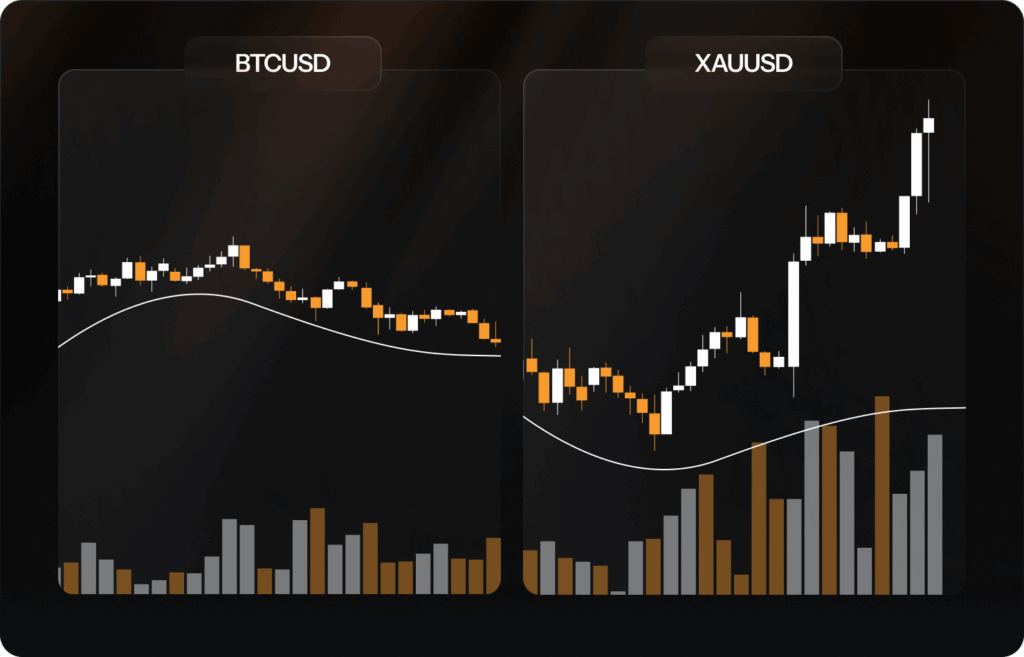
Volume is a key component of historical liquidity. In short, volume is simply the number of executed trades that took place over a particular period. While volume indicators can’t tell you much about real-time liquidity, they can be a useful tool to study past liquidity patterns and analyze whether a potential trade is likely to move the market.
Metrics in this category include:
- Average daily trading volume. This simple metric reflects the average quantity of the asset that changes hands each day. If a potential trade could account for a significant portion of an asset’s daily volume, the potential for price impact is greater.
- Volume-weighted average price. This visual indicator shows an asset’s average price throughout a trading day weighted by trading volume. Also known as VWAP, this tool can help traders identify how liquidity contributed to historical price trends and reversals.
- Turnover ratio. Most relevant to equity traders, the turnover ratio indicates how frequently the outstanding shares of a company change hands. Stocks with a low turnover ratio may have investors who don’t frequently trade shares, leading to relatively low liquidity.
Category #3: Quantitative statistics
For advanced traders, especially those using algorithmic strategies, quantitative statistics can be useful to help characterize liquidity. Although order book and bid-ask spread measures are often sufficient to analyze the current state of an asset’s liquidity, these metrics can potentially help traders identify profitable opportunities tied to changes in liquidity:
-
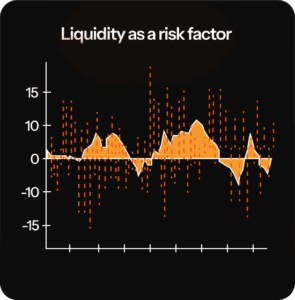
Pastor–Stambaugh liquidity measure. The Pastor–Stambaugh model is an extension of factor investing models, which attempt to identify the risk factors that drive asset returns. This model incorporates changes in liquidity as an additional factor, with the prices of some assets being more sensitive to these changes than others.
-
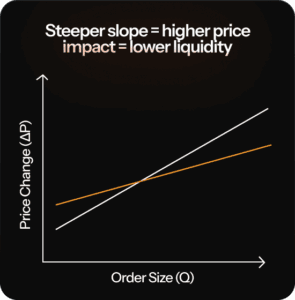
Kyle’s lambda. This metric is a way to estimate the price impact of a certain trade, meaning it can be useful for traders attempting to size their positions in low-liquidity environments. Kyle’s lambda for an asset is calculated by running a regression on price changes with order volumes.
-
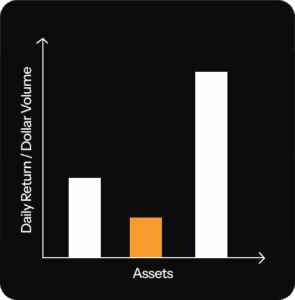
Amihud illiquidity ratio. The Amihud illiquidity ratio is a simpler measure that reflects the ratio of an asset’s absolute daily return to its dollar volume. While potentially less useful than Kyle’s lambda for forecasting the price impact of an individual trade, this ratio can be utilized to quickly scan and identify assets with greater and lesser degrees of estimated illiquidity.
These three categories move in increasing order of overall complexity. As traders employ more sophisticated strategies, they may gradually move from simple volume-based measures to complex quantitative ones to better understand how liquidity impacts their profitability.
Practical Trading Strategies for Different Liquidity Environments
When liquidity is ample, traders generally don’t need to think about its impact. In markets with deep order books and professional liquidity providers, individual traders are unlikely to experience significant slippage or price impact. That means traders can pursue a wide variety of strategies, including short-term styles like order flow analysis.
But in less-liquid environments, traders often need to be more tactical about their approach. While some assets are structurally illiquid, even some highly liquid asset classes can experience shallow periods. In either case, five key strategies can help investors navigate low liquidity.
Strategy #1: Break up orders
The first and most straightforward strategy to navigate a low-liquidity environment is to break up orders into smaller chunks. For example, suppose that capitalizing on a trading opportunity requires acquiring 1,000 shares of a stock. Instead of buying all 1,000 at once and overwhelming the order book, consider placing four separate 250-unit orders over the course of an hour.
The level to which you need to break up your orders depends on how illiquid the market is. Using volume-based and order book metrics can help traders gauge the order size that a market can absorb without distorting prices. Institutional investors frequently use a similar strategy called ‘iceberg orders’ to execute a trade over time without revealing the true position size.
Strategy #2: Smaller position sizes
In addition to executing traders over time, consider using smaller position sizes in an illiquid market. For example, imagine a trader who seeks to carry 10 different trading positions on their book at any given time. In a less-liquid environment, it may be more beneficial for this trader to hold 20 positions, each half the size of a standard one.
Of course, traders need to consider whether they’ve identified a sufficient number of opportunities to scale down their sizes while still meeting profitability goals. Nonetheless, smaller positions can reduce the impact of slippage and price impact when entering and exiting a trade.
Strategy #3: Utilize limit orders
As we’ve seen, market orders bear the greatest cost of illiquidity. Slippage, price impact, and crossing the spread primarily affect market orders, since they demand immediate execution (limit orders can still partially fill). As a result, utilizing limit orders instead of market orders can be a valuable strategy in a market with low liquidity.
Limit orders can require a different approach than using market orders. Because these orders are only executed if a specific price is reached, investors may not be able to capitalize on fast-moving opportunities. With that said, limit orders can also allow traders to earn the bid-ask spread, which can be a source of additional profit.
Strategy #4: Trade during liquidity peaks
Even though a market might be relatively illiquid on average, there can still be pockets of high liquidity for traders to take advantage of. These ‘peaks’ often occur during key trading hours (such as the New York-London overlap in forex) or just after/before market opening/closing times. For example, an illiquid stock might see a consistent volume spike just before the market closes as investors adjust their positions, which traders can capitalize on.
Strategy #5: Longer-term styles
Finally, traders may simply need to adjust their overall trading style in illiquid markets. This is especially true for short-term styles like scalping and day trading, which often rely on a speed of execution that may not be possible during periods of low liquidity. Styles like swing trading and pattern trading are typically not dependent on immediate execution and come with less frequent trading overall.
Conclusion
It’s already common for traders to closely analyze details like set-ups, position sizing, and entry/exit timing. However, the impact of liquidity is often not fully appreciated. That matters – institutional traders already factor liquidity into nearly every trading decision they make (even profiting from liquidity conditions when the time is right).
For individual traders, incorporating liquidity into their trading strategy starts with basic tools like analyzing volume and tracking bid-ask spreads. These tools can give traders enough insight to begin successfully using approaches like breaking up their orders or trading during liquidity peaks. Advanced quantitative measures may allow traders to turn the tables and start benefiting from low liquidity environments.
Whatever your trading strategy, understanding liquidity can help you better implement it. But to effectively incorporate liquidity, traders need the right tools. That’s why OneFunded offers access to an advanced prop trading platform for traders looking to take their approach to the next level.
With direct integration with TradeLocker, a dedicated community, and lightning-fast execution, OneFunded offers prop traders the resources they need to understand and incorporate liquidity into their approach. Ready to get started? Start your trading challenge today and prove your skills.