Chart patterns are one of the most widely taught concepts in technical analysis and one of the most widely misused. Recognising a pattern on a chart is just the beginning. Without context, confluence, and an understanding of the market structure behind it, a pattern alone is nothing more than a shape.
Patterns Don’t Work in Isolation
Open any trading book published in the last 50 years and you will find chart patterns presented as reliable, standalone signals. “When you see a head and shoulders, sell.” “A double bottom means buy.” This kind of thinking has cost retail traders enormous amounts of money.
The hard truth is this: a chart pattern on its own carries very little edge. The same head and shoulders pattern will fail more often than it succeeds if it appears in the middle of a range, against the trend, or at a level with no structural significance. Conversely, the same pattern at a key higher timeframe resistance level, in a bearish market structure, after a liquidity sweep, becomes a genuinely high-probability setup.
The pattern is the trigger. The context is the edge. Your job as a trader is to only pull the trigger when the full context aligns. That is what separates consistent traders from gamblers who happen to know the names of shapes.
⚠️ THE CORE WARNING
Before entering any trade based on a chart pattern, ask yourself: Would I take this trade without the pattern? If the market structure, trend direction, key level, and overall context all point in the same direction, the pattern is simply the final confirmation. If the answer is no, then the pattern alone is not enough.
Reversal Patterns
Reversal patterns signal a potential change in the prevailing trend direction. They form after a sustained move up or down and suggest that the momentum driving that move is exhausting. Always look for these patterns at significant structural levels — a reversal pattern in the middle of nowhere is almost meaningless.
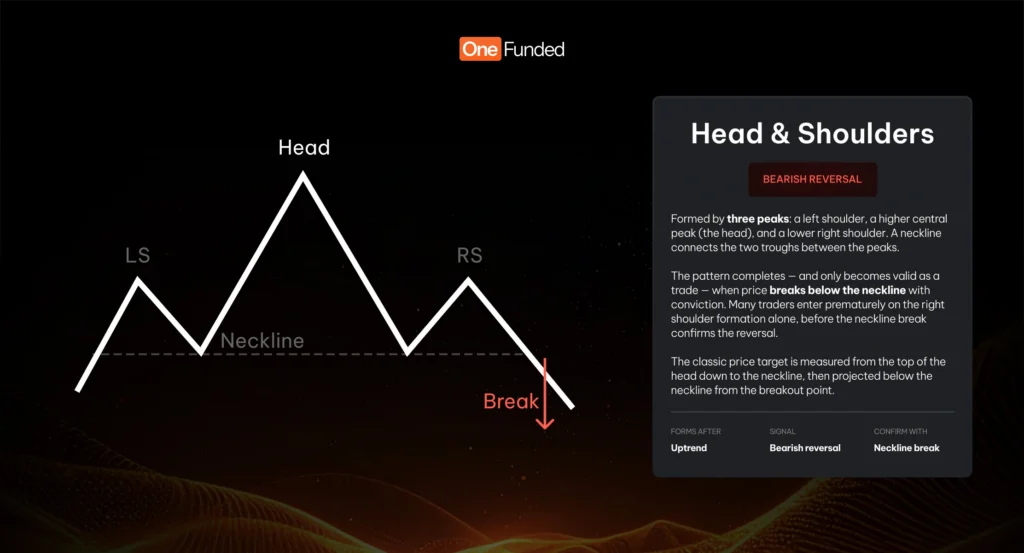
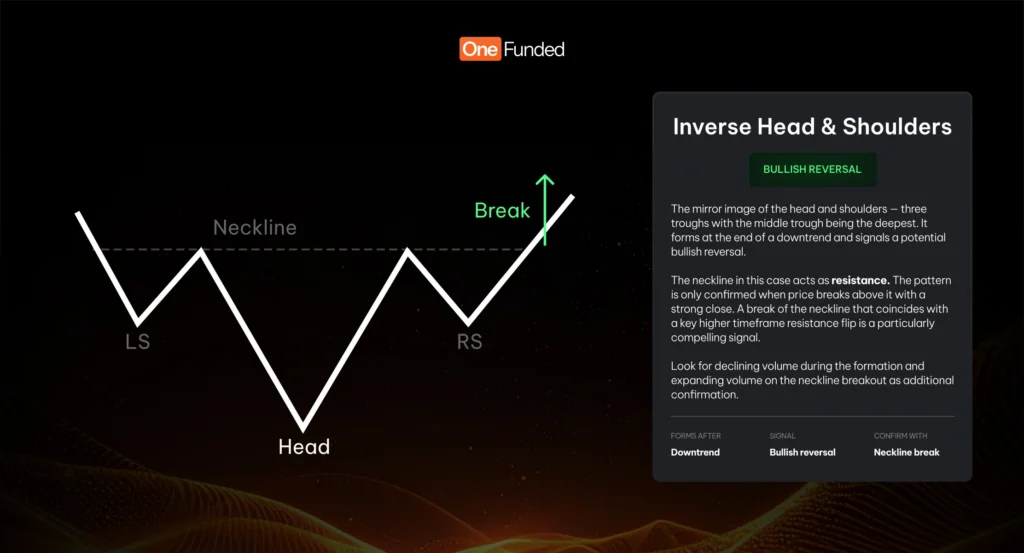
- Head & Shoulders:
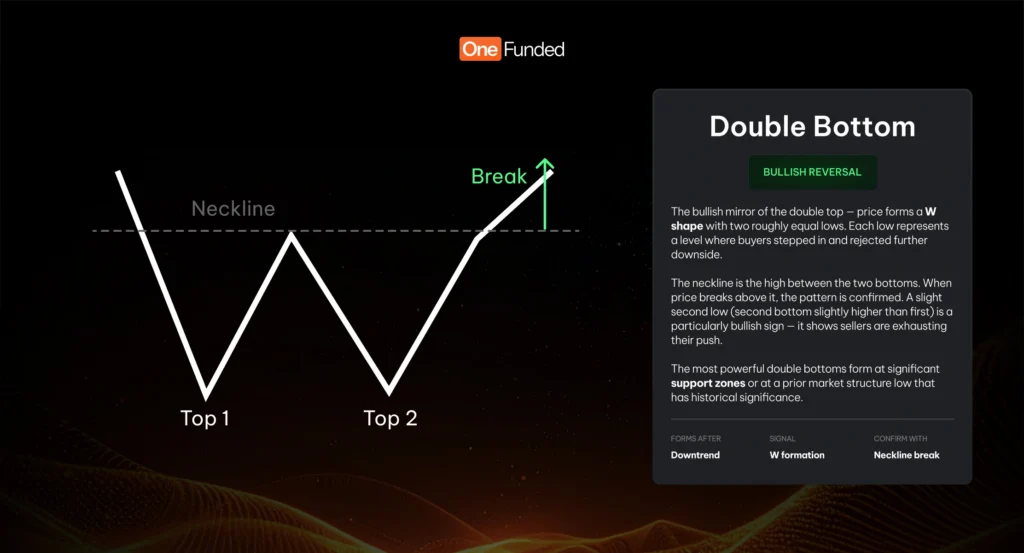
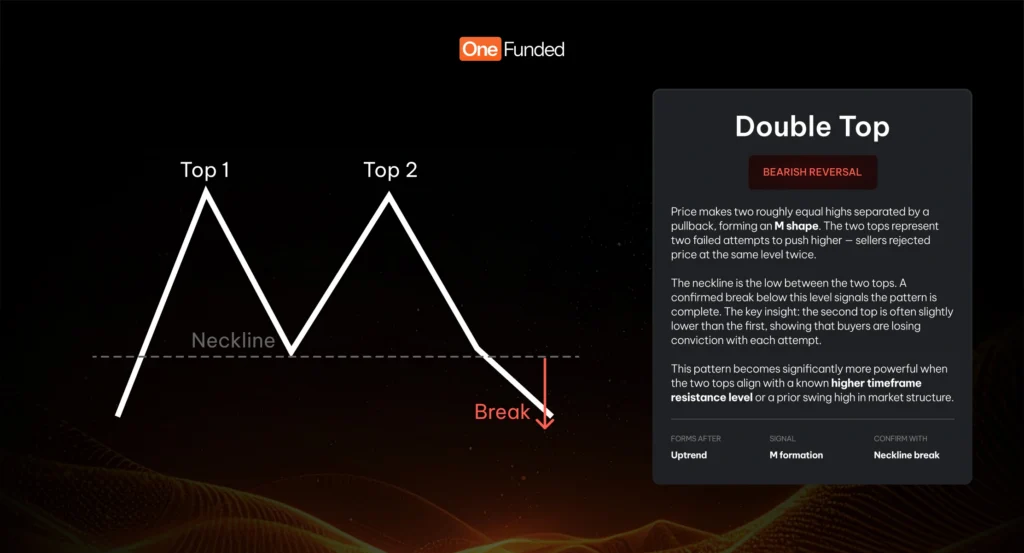
2. Double Top & Double Bottom
Continuation Patterns
Continuation patterns form during a pause within an existing trend. They represent a period of consolidation — the market is breathing before continuing in the same direction. These patterns are traded in the direction of the prevailing trend and lose much of their value when traded counter-trend or in a ranging market.
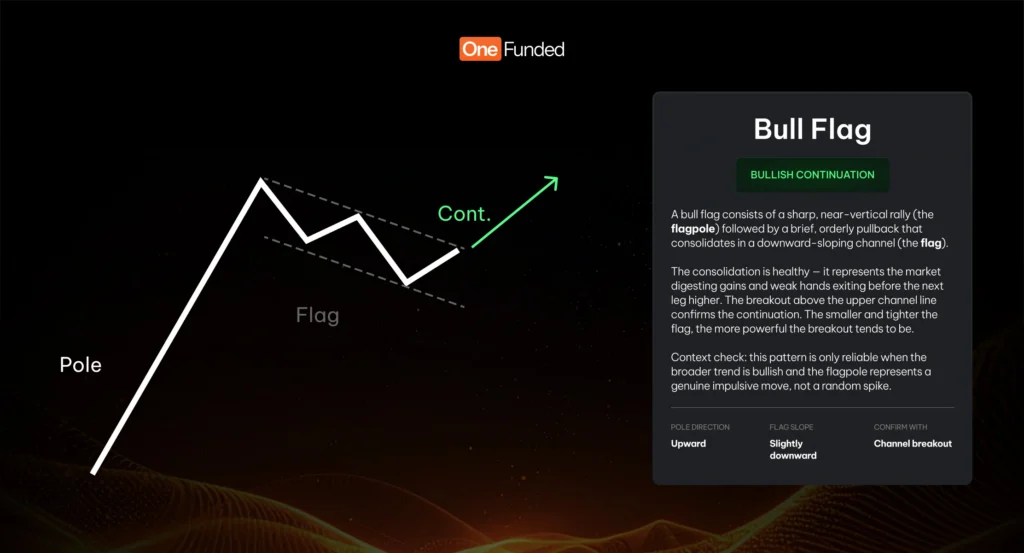
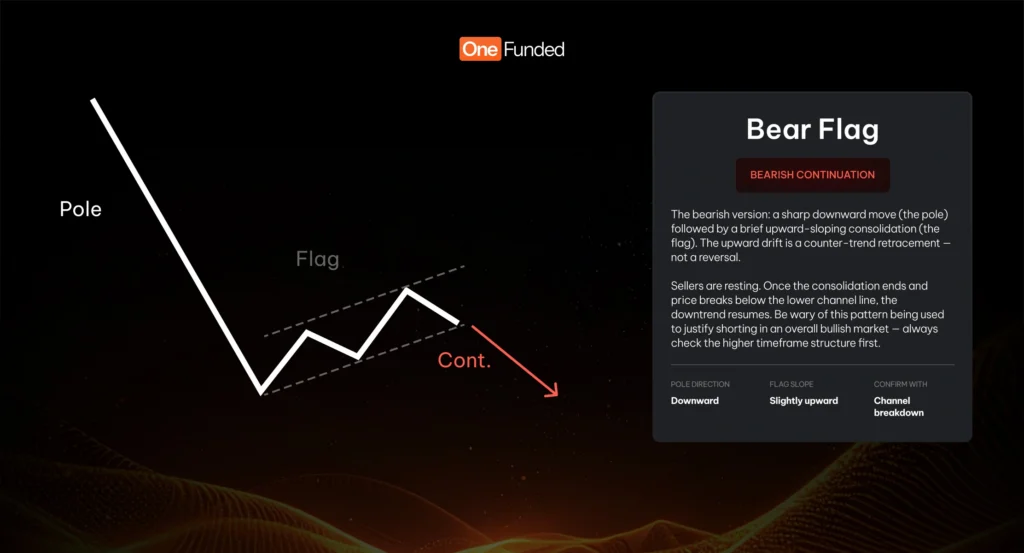
1. Bull Flag & Bear Flag
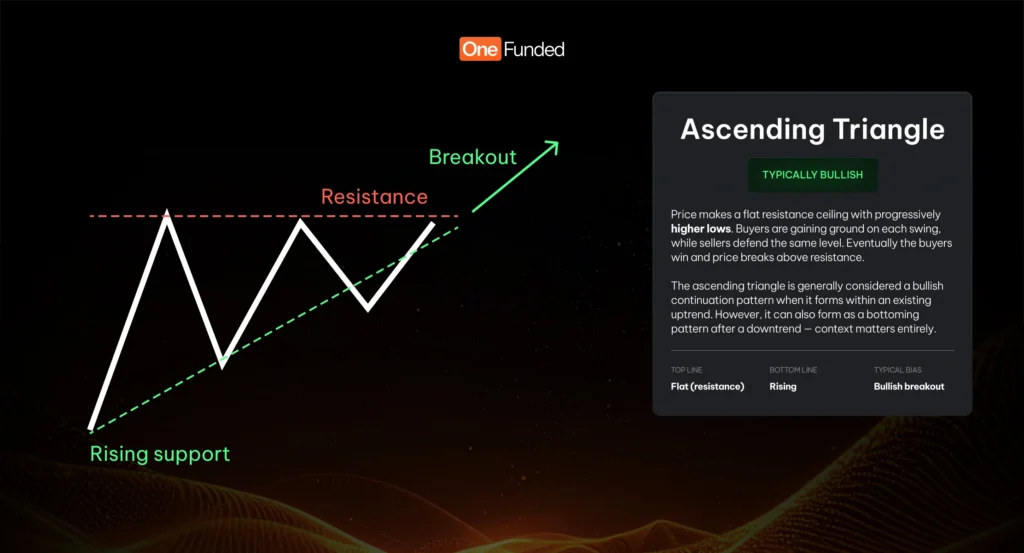
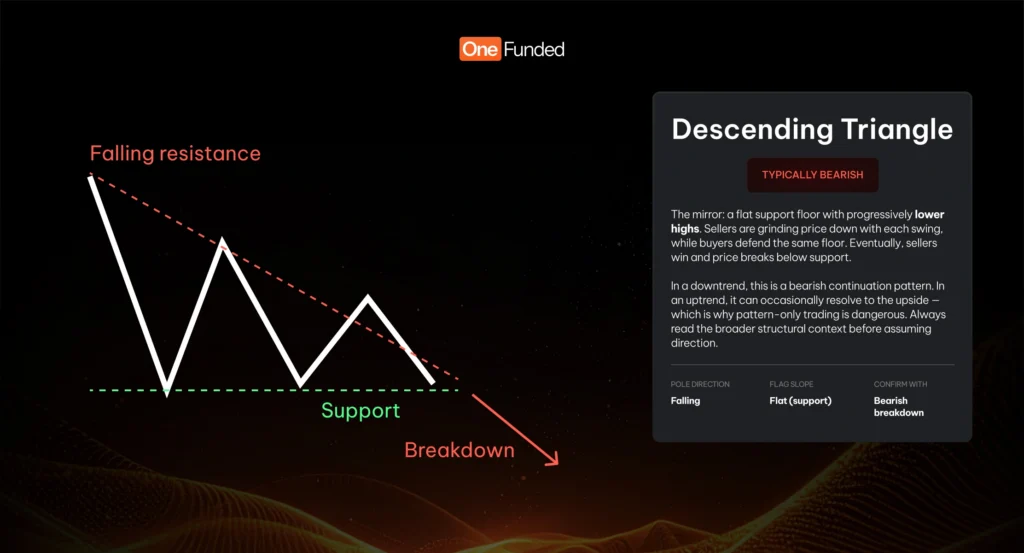
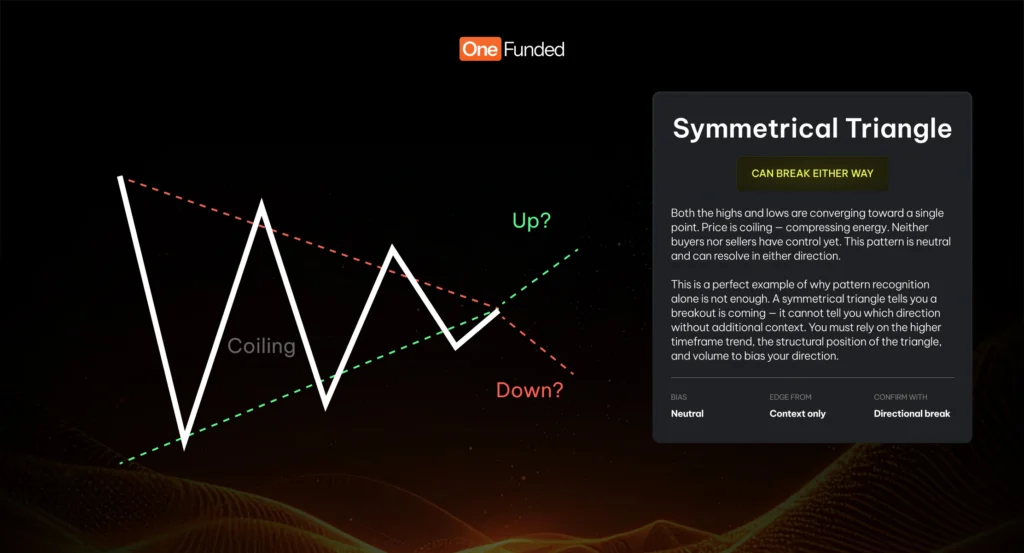
2. Triangle Patterns
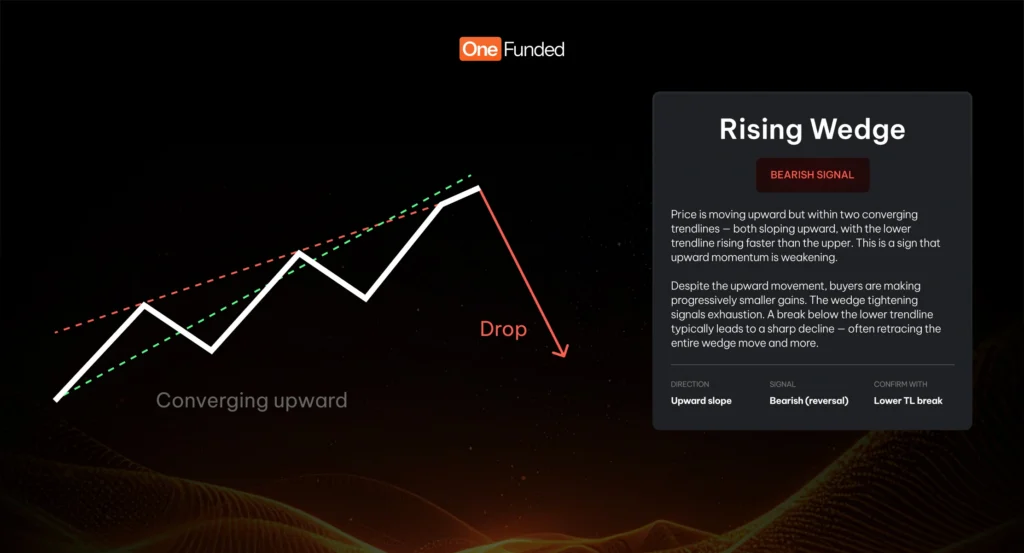
3.Rising & Falling Wedge
Pattern Quick Reference Table:
| Pattern | Type | Forms After | Direction Bias | Confirmation |
|---|---|---|---|---|
| Head & Shoulders | Reversal | Uptrend | Bearish | Neckline break down |
| Inv. Head & Shoulders | Reversal | Downtrend | Bullish | Neckline break up |
| Double Top | Reversal | Uptrend | Bearish | Neckline break down |
| Double Bottom | Reversal | Downtrend | Bullish | Neckline break up |
| Bull Flag | Continuation | Uptrend | Bullish | Channel break up |
| Bear Flag | Continuation | Downtrend | Bearish | Channel break down |
| Ascending Triangle | Continuation | Uptrend | Bullish (typical) | Resistance break up |
| Descending Triangle | Continuation | Downtrend | Bearish (typical) | Support break down |
| Symmetrical Triangle | Neutral | Either | Context dependent | Directional break |
| Rising Wedge | Reversal | Uptrend | Bearish | Lower TL break |
| Falling Wedge | Reversal | Downtrend | Bullish | Upper TL break |
Why Confluence Is Everything
The patterns above are tools — they are not strategies. A hammer is a useful tool, but it is useless if you do not know what nail you are hitting or where. The same applies here. Before entering any trade based on a chart pattern, you must stack the context in your favour. This is called confluence — multiple independent reasons pointing to the same trade.
A head and shoulders pattern forming at a random point in a range? Low probability. The same pattern forming at a major higher timeframe resistance level, in a broader downtrend, after a liquidity sweep above a key swing high? That is a completely different trade. The pattern did not change — the context did.
Below are the key confluence factors to look for before entering a pattern-based trade:
- Higher Timeframe Market Structure. Is the pattern forming in alignment with the HTF trend? A bullish reversal pattern is far stronger when the daily chart is also in a bullish phase or at a major HTF support.
- Key Structural Level. Is the pattern forming at a significant swing high, swing low, or prior area of value? A double top means far more when it forms exactly at the prior week’s high or a strong daily resistance level.
- Liquidity Sweep / Stop Hunt. Did price briefly spike beyond a key level before reversing into the pattern? This is a sign of smart money engineering a move — clearing liquidity before the real direction is revealed. A pattern that forms after a liquidity sweep is significantly more reliable.
- Lower Timeframe Confirmation (MSS). Before entering on a pattern, drop to a lower timeframe and look for a Market Structure Shift in the direction you want to trade. This provides a precise entry rather than a wide, risky entry at pattern completion alone.
- Risk/Reward Ratio. Even with all confluences aligned, only take the trade if the risk/reward is favourable — minimum 1:2, ideally 1:3 or better. A good pattern at a perfect level means nothing if your stop needs to be too large relative to the target.
THE FRAMEWORK
Think of your trade setup as a checklist: (1) Higher timeframe bias → (2) Key structural level → (3) Pattern forms → (4) Liquidity swept → (5) LTF confirmation → (6) Entry. The pattern is step 3 of 6. It matters but it is not the whole picture.
Common Mistakes When Trading Patterns
- Entering before confirmation. One of the most common errors is anticipating a pattern completing and entering too early. Wait for the defined confirmation before committing: neckline break, channel breakout, trendline break. Being early feels smart until the pattern fails.
- Forcing patterns onto the chart. Not every consolidation is a flag. Not every pair of highs is a double top. If you have to squint, adjust your lines repeatedly, or argue with yourself about whether the pattern is valid — it probably is not. Clean patterns are obvious. If it is not obvious, move on.
- Ignoring the overall trend. Trading a bearish reversal pattern in the middle of a strong bull trend is a low-probability exercise. The trend is your greatest ally. Align your patterns with it, not against it — unless you have overwhelming confluence for the counter-trend trade.
- Not planning the trade before entry. Before entering, you should know exactly: where your stop loss goes, where your target is, and what your risk/reward ratio is. This should be established before the entry, not after. Pattern recognition is useless without trade management.
Summary
Chart patterns are a valuable part of a trader’s toolkit, but they are a lens through which to view price — not a signal system to follow blindly. Used correctly, they give you a defined entry trigger, a clear invalidation point, and a logical price target. Used incorrectly, they give you false confidence in low-probability trades.
The traders who use patterns successfully are not the ones who have memorised the most shapes. They are the ones who understand why each pattern forms, what it tells you about the balance of power between buyers and sellers, and — most importantly — when the broader context makes that pattern meaningful.
Build your confluence. Read the structure. Let the pattern be the final piece that triggers your entry — not the first and only reason you take a trade.