
If you’ve been trading long enough, you’ve likely experienced a familiar scenario: markets that were calm and placid suddenly experience an unexpected spike in volume and volatility. Researching what happened, you discover that a key piece of economic data was released that day, prompting a sharp market reaction. Since you weren’t paying attention to the economic calendar, the release took you by surprise.
Avoiding moments like this is one of the most important reasons to pay attention to the economic calendar, helping prevent unpleasant surprises from derailing your profitability. In fact, strategically monitoring data releases and policy decisions can even allow you to profit from such episodes. In this article, we’ll explore what the economic calendar is, why it matters, and how traders can use it to their advantage and enhance their overall strategy.
Key Points:
- The release of important economic data and policy decisions is rarely random. Instead, these releases typically follow a regular schedule. Altogether, these regular releases form the ‘economic calendar.’
- Institutions like governments, central banks, international organizations, private sector groups, and even publicly listed companies all help form the economic calendar. Depending on which markets a trader operates in, some releases may be more impactful than others.
- The most important events on the economic calendar fall into one of five major categories: interest rate decisions, corporate earnings data, inflation indicators, employment figures, and growth metrics. In addition to these core elements, other releases like trade balance data and sentiment surveys can also affect markets.
- It’s possible to profit from the economic calendar, such as by pre-positioning your portfolio before an event or trading the release of key data. However, many traders also avoid the markets during major news events, which can come with added volatility and uncertainty.
What is the Economic Calendar? Understanding the Fundamentals
Every day, investors and traders around the world analyze the latest economic data to try to understand the future path of financial markets. While not every piece of data is equally important, these individual numbers all contribute to a broader understanding of where key asset classes might be headed. The regular release of such data, which typically follows a consistent schedule, is known as the economic calendar.
As an example of the economic calendar in action, consider some of the most highly anticipated events in financial markets: the Federal Reserve’s rate-setting meetings. Eight times a year, the Fed meets to decide on adjustments to US interest rate policy, with announcements of rate changes coming shortly after. The dates for these meetings are published well in advance, and traders frequently position their portfolios around anticipated changes.
While the eight Fed meetings are some of the most well-known dates on the economic calendar, other events are important too. In particular, data releases relating to factors like inflation, growth, and labor market conditions in major economies tend to be highly influential. Aside from these data releases, some institutions also publish widely anticipated forecasts and projections about the expected future path of the economy.
What does the economic calendar look like?
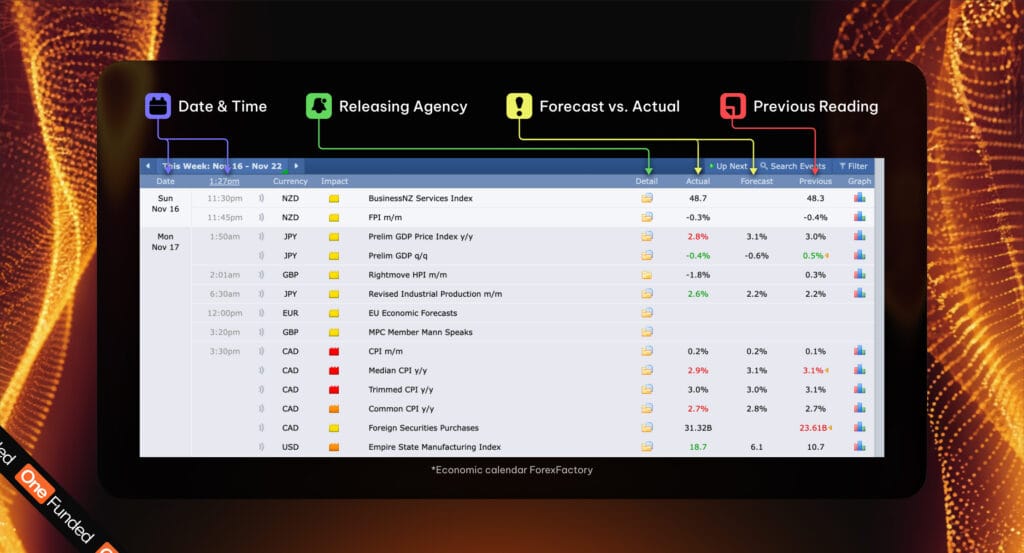
On many platforms, the economic calendar is formatted into a literal day-by-day schedule for traders to monitor. Key elements of this schedule often include:
- Date and time. Some events on the economic calendar occur early in the day – major data releases often happen before the market opens. However, others may occur throughout or after the trading day.
- Forecasts and estimates. Wall Street analysts typically publish detailed forecasts about important events on the economic calendar. Depending on how these events unfold, the actual results can diverge significantly from forecasts, potentially leading to major market movements.
- Prior readings. For regularly scheduled releases, economic calendars typically show the reading for the previous round of data. This can help traders quickly understand the magnitude of changes between events.
- Agency and revision details. Calendars may also include which agency or institution is conducting the event. In America, for example, the Bureau of Labor Statistics is responsible for releasing many key figures on the US economic calendar. Some events may also reflect updated estimates for previously released figures, known as ‘revisions.’
In addition to these elements, some platforms may also include rankings of the importance or likely volatility impacts of scheduled events. As traders become more experienced, they will develop their own understanding of the events that matter most and which data is worth paying attention to. Building that intuition is important, since there are a tremendous number of events on the economic calendar sponsored by a diverse array of institutions.
Creating the economic calendar: Data providers and decision-makers
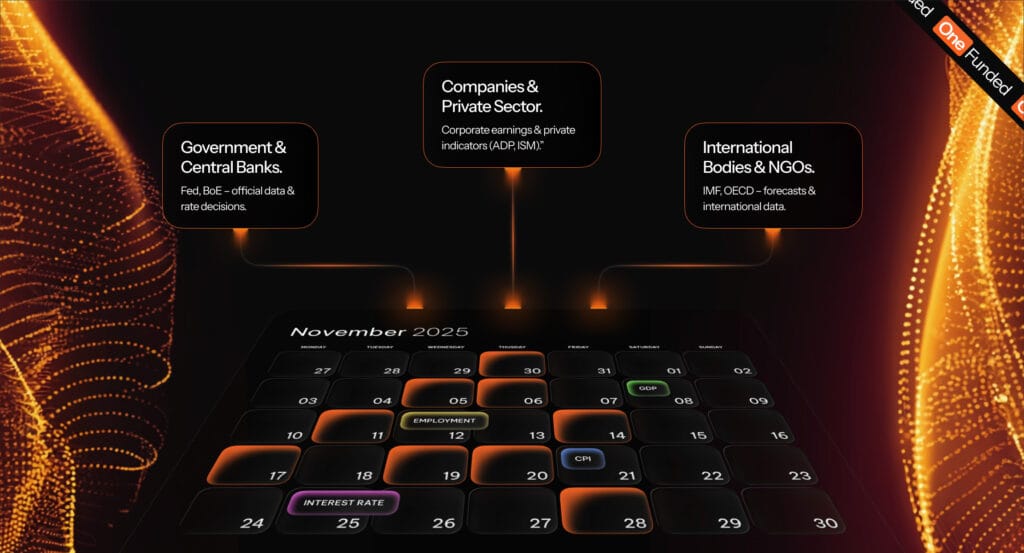
There are three major groups of institutions responsible for populating most of the economic calendar:
- Government agencies and central banks. Government agencies, such as the Bureau of Labor Statistics in the US or the Office for National Statistics in the UK, are some of the primary providers of official data on the economic calendar. In addition, central banks such as the Federal Reserve or the Bank of England are responsible for interest rate decisions, as well as many key economic forecasts.
- Companies and private sector groups. Corporate earnings announcements from publicly listed companies can be a key source of economic data, especially when it comes to guidance from management teams. In addition, some private sector groups also release widely followed economic indicators, such as ADP’s national employment statistics and the Institute for Supply Management’s sentiment surveys.
- International bodies and NGOs. International bodies and non-governmental organizations (NGOs) are also responsible for many forecasts and data releases. For example, the International Monetary Fund is known for producing authoritative growth forecasts, while the Organisation for Economic Co-operation and Development releases uniform economic data on member countries.
On any given business day, it’s not uncommon for there to be dozens of events on the economic calendar. That can add up to thousands of individual releases each year. However, many of these events do not contribute to major market changes, making it essential to understand which releases matter most.
Key Dates on the Economic Calendar: Rates, Inflation, and Other Important Categories
To better understand the events that make up the economic calendar and why traders monitor them, we’ll review some of the most important regularly scheduled events. There are five main groups of events worth paying attention to, although other categories have also become increasingly impactful in recent years.
Group #1: Interest rate decisions
Typical schedule: Every six weeks (8x per year)
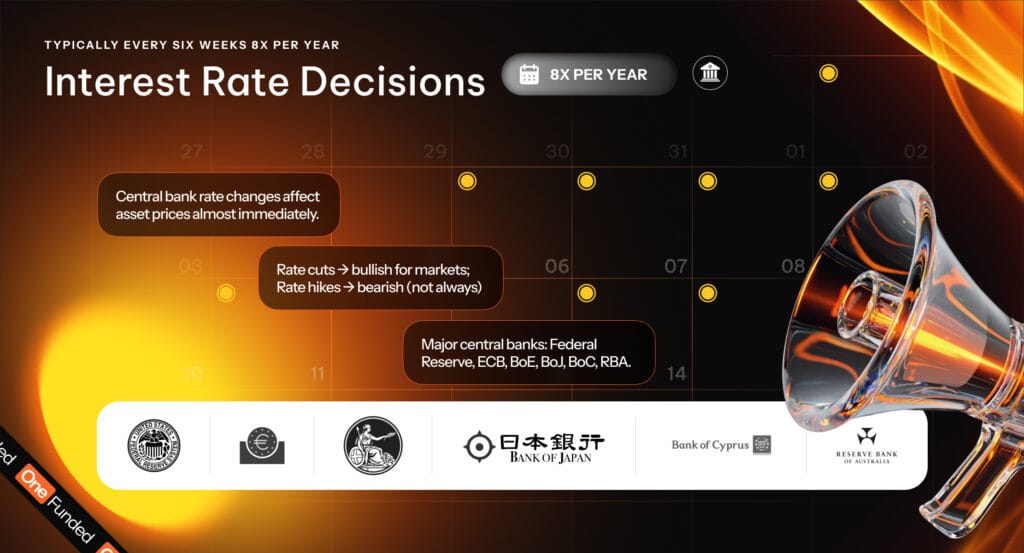
Central bank interest rate decisions are by far some of the most important regularly scheduled events on the economic calendar. Changes to rate policy can affect asset pricing in financial markets almost immediately. They can also dramatically shift expectations about future growth and inflation data.
As we discussed, the Federal Reserve’s rate meetings are widely considered the most important in the world due to America’s leading role in the global financial system, forming key events on the US economic calendar. However, rate decisions from other central banks like the Bank of England, Bank of Japan, Bank of Canada, European Central Bank, and the Reserve Bank of Australia are also widely influential. Rate-setting meetings generally happen about once every six weeks, although each central bank determines its own schedule.
To avoid surprising financial markets, modern central banks typically try to communicate anticipated rate movements ahead of time using so-called ‘forward guidance.’ Nonetheless, when there is significant uncertainty about potential rate changes, these decisions can drive large market movements. Rate cuts tend to be bullish for asset prices, while rate hikes are often bearish (although not all markets abide by this rule of thumb).
Group #2: Corporate earnings data
Typical schedule: Quarterly (4x per year)
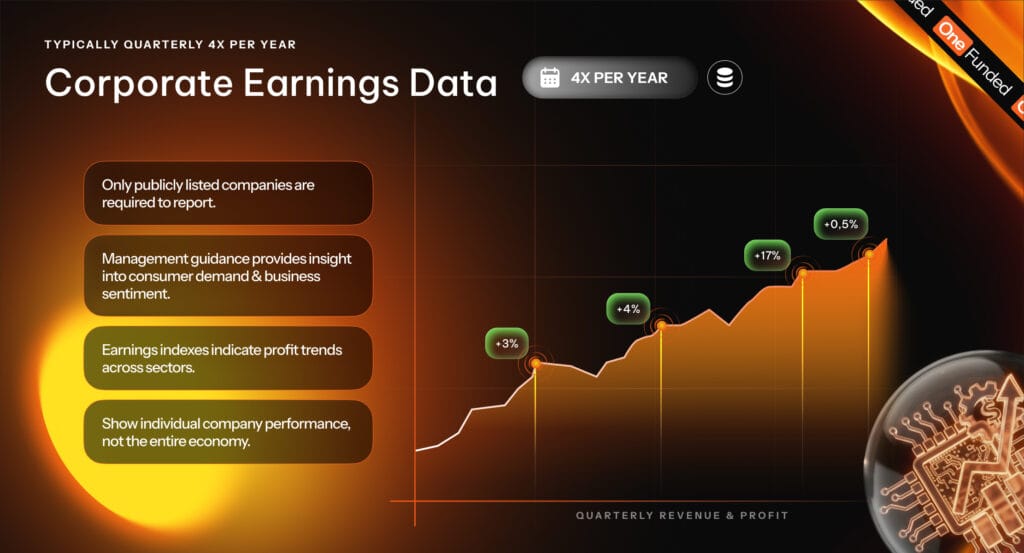
Traditionally, corporate earnings data hasn’t always been considered a part of the standard economic calendar. That’s because earnings releases show data for individual companies, not the broader economy as a whole. In recent years, however, the importance of paying attention to earnings figures to understand the economy has become increasingly evident.
Taken together, corporate earnings indexes can help demonstrate whether profits across an economy are growing or shrinking. In addition, management teams at major corporations often provide valuable information about consumer demand and business sentiment. That’s especially true when a certain industry is driving meaningful economic shifts, such as the AI sector.
Corporate earnings typically follow a quarterly schedule, with companies releasing data and holding investor calls four times per year. However, in some countries, regulators only require earnings releases twice per year. It’s important to note that only publicly listed companies are generally required to release their financial statements, meaning that investors typically lack access to earnings information from unlisted companies.
Group #3: Inflation indicators
Typical schedule: Monthly (12x per year)
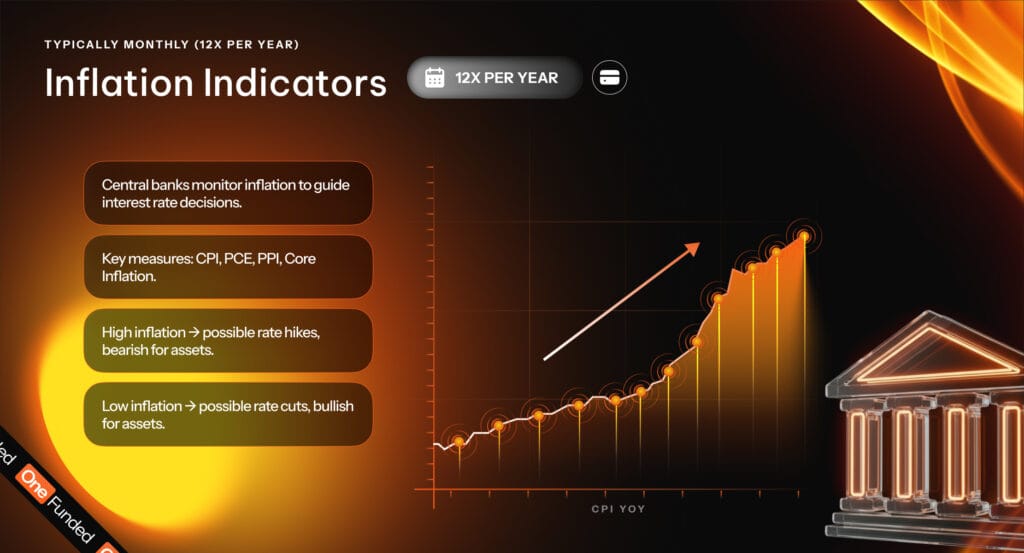
Central banks in advanced economies generally have a mandate to control inflation. Target inflation rates around 2% are typical. Since realized inflation levels have a significant impact on interest rate decisions, inflation indicators are some of the most important data on the economic calendar.
These figures are generally released on a monthly basis. In the US, the BLS generally releases the Consumer Price Index (CPI) in the middle of each month. In addition, the Bureau of Economic Analysis also releases the Personal Consumption Expenditures (PCE) index monthly, which the Fed uses as its preferred inflation gauge.
In Europe, Eurostat is responsible for releasing the Harmonised Index of Consumer Prices for EU members on a monthly basis, including for countries like Germany, France, and Italy. The agency typically releases a ‘flash’ estimate at the end of each month (or shortly after), with the full estimate coming several weeks later.
The UK, Japan, and Canada all produce monthly CPI reports from their respective statistical agencies. In Australia, CPI is only updated with an official estimate quarterly, but monthly releases serve as useful indicators. Aside from headline CPI numbers, investors also generally pay attention to inflation measures such as the Producer Price Index (PPI) and core inflation measures (which strip out volatile categories like food and energy).
Group #4: Employment figures
Typical schedule: Monthly (12x per year)
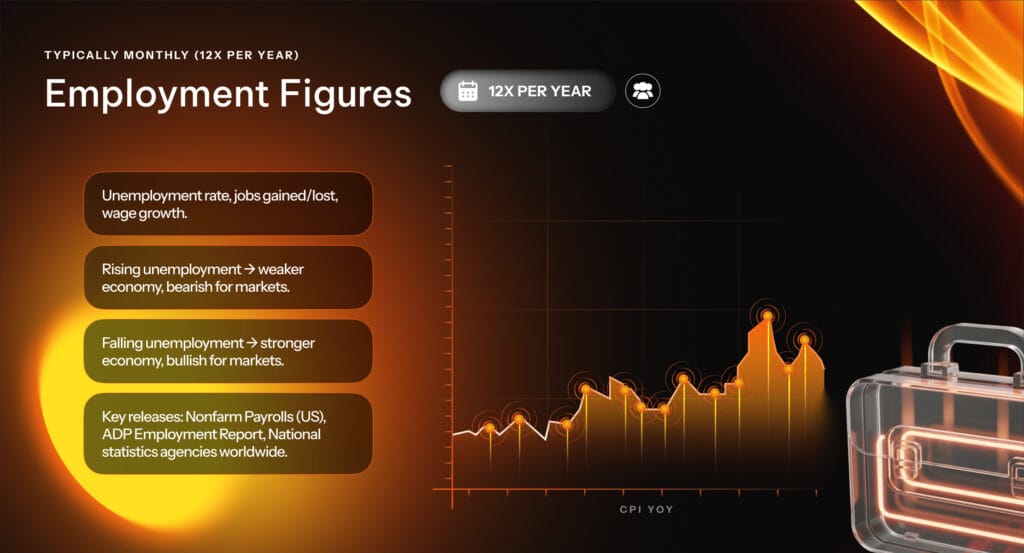
The labor market serves as a key indicator of economic health. If unemployment rises, reduced consumer spending power could increase the odds of a recession. On the other hand, declining unemployment and rapid business hiring tend to indicate a strong and growing economy.
In addition to the headline unemployment rate, national statistics agencies also tend to release other key labor market figures such as wage growth, changes in hours worked, and job openings. In the US, for example, ‘nonfarm payrolls’ is a widely tracked measure of the number of jobs gained or lost in the American economy over the previous month.
Employment figures are generally released monthly in most advanced economies, often by the same agency that releases inflation data. Importantly, some private sector data releases are also considered useful labor market indicators. In the US, for instance, the National Employment Report released by ADP offers an alternative view of employment compared to official statistics.
Group #5: GDP and growth metrics
Typical schedule: Quarterly (4x per year)
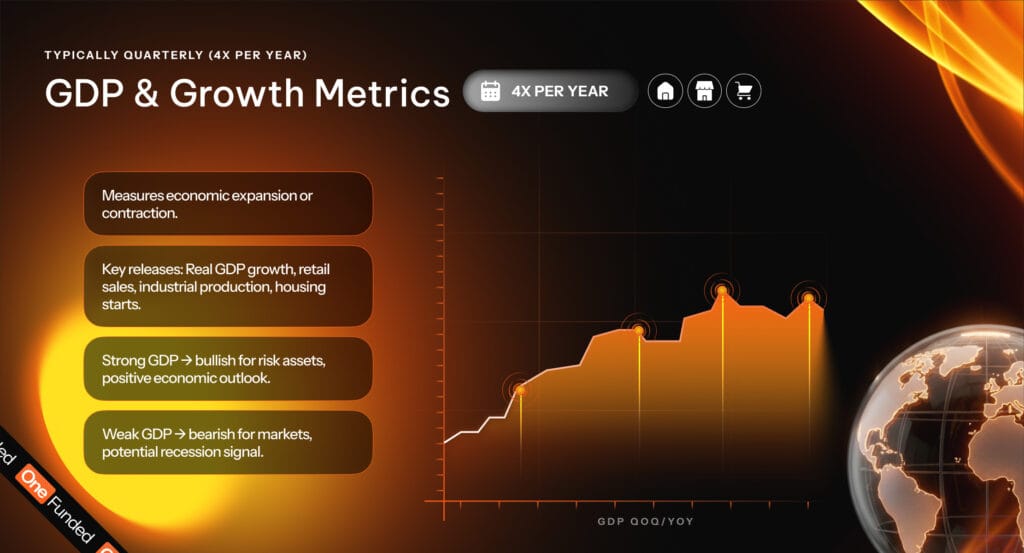
Finally, GDP and other growth measures offer some of the most direct insight as to whether a national economy is expanding or contracting. Almost every advanced economy releases official GDP metrics every three months. In the US, for example, the BEA releases an initial GDP estimate quarterly, with follow-on revisions as more data is collected.
In some countries, preliminary GDP estimates are also released monthly, such as in the UK. Moreover, proxy measures for economic growth are typically released more frequently than GDP itself – these can include data on retail sales, new housing starts, and industrial production. Lastly, international bodies like the IMF release widely referenced GDP forecast measures, with many individual central banks also publishing short-term growth projections.
Overview of key categories on the economic calendar
| Category Name | Typical Release Frequency | Headline Figures | Releasing Institution |
| Inflation indicators | Monthly | MoM & YoY CPI growth | National statistics agency |
| Employment figures | Monthly | Unemployment rate, jobs gained/lost | National statistics agency |
| Interest rate decisions | Every six weeks | Policy interest rate changes | Central banks |
| Corporate earnings data | Quarterly | QoQ & YoY revenue and profit growth | Publicly listed companies |
| GDP and growth metrics | Quarterly | QoQ & YoY real GDP growth | National statistics agency |
Other high-impact events on the calendar
While these five main categories capture the most impactful events on the economic calendar, other categories can matter too:
- Trade balance and current account data. In recent years, as international trade has become more fractured and ‘deglobalization’ has accelerated, import/export data has taken on a more significant role in trading decisions. Trade balance data, which measures the gap between imported and exported goods, is often released on a monthly basis by national trade regulators. In addition, data on financial flows between countries can also potentially impact market pricing.
- Sentiment surveys. Sentiment surveys are unique in that they do not reflect fundamental economic data. Instead, they simply show how consumers or businesses feel about the economy. Surprisingly, sentiment can have a genuine impact on economic performance, since optimism tends to drive greater spending and investment. The most well-known examples of sentiment surveys include the Institute for Supply Management’s producer surveys and the University of Michigan’s consumer surveys in the US.
- Geopolitical events and elections. Geopolitical events, such as the outcome of a high-stakes international negotiation, can profoundly impact financial markets. So too can national elections, which often influence expected fiscal conditions in a country. While these events aren’t always reflected on standard economic calendars, traders exposed to key political episodes often track these dates personally.
Now that we’ve covered both what an economic calendar is and what the most significant events on that calendar are, we can turn to the real market impacts. Although the economic calendar has the potential to drive changes across the financial landscape, certain markets are more strongly exposed than others.
Economic Calendar by Asset Class: How Are Markets Affected?
Generally speaking, the foreign exchange market and the bond market tend to be impacted most immediately by events on the economic calendar. That’s because these asset classes are often directly priced based on current and expected interest rates. However, equities, commodities, and cryptocurrencies can also experience substantial shifts, although the mechanisms tend to be more indirect.
Forex: Interest rate differentials, financial flows, and investor sentiment
Currency pairs in the foreign exchange (forex) market are strongly affected by current and expected economic conditions in the underlying countries. The currencies of strong economies tend to appreciate, and vice versa for weak economies. In addition to that basic dynamic, other factors can also result in calendar events driving currency adjustments:

- Policy rate shifts. The relative level of interest rates between two countries is one of the main factors impacting their exchange rate. For example, if American rates rise above British rates, the dollar will likely appreciate as traders seek to swap their pounds for the higher-yielding currency. As a result, central bank rate decisions, along with labor market and growth data, can drive pricing adjustments.
- Financial flows. Financial flows can also impact currency prices for reasons beyond interest rate considerations. For example, if Japan begins exporting huge volumes of goods, foreign buyers will likely need to acquire yen to pay for these goods. This shift in financial flows could cause the yen to appreciate against other currencies.
- Investor sentiment. When investors feel nervous about the future, which could be triggered by poor economic growth or a deteriorating labor market, they often seek assets that remain resilient during bearish periods. Some currencies are widely considered to be ‘safe-haven’ assets, such as the Swiss franc. If investor sentiment declines following events on the economic calendar, these currencies may appreciate.
Equities: Sector rotation and earnings growth
Of all the events on the economic calendar, the equity market is most directly affected by corporate earnings releases. When a company releases unexpectedly strong earnings, its stock may appreciate. Moreover, if those earnings indicate rising prospects for the company’s industry, shares in the firm’s competitors could rise as well.
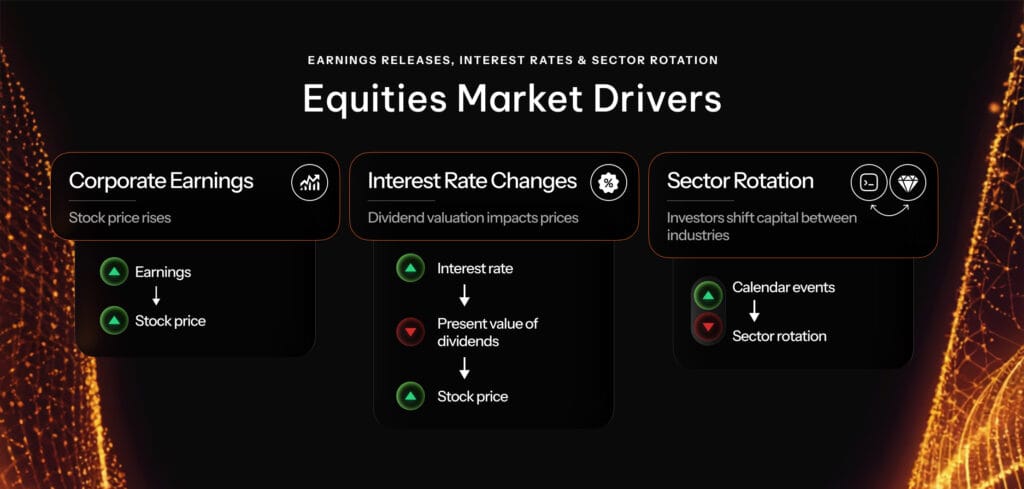
However, it would be a mistake to think that earnings are the only events that impact equities. In particular, stock prices tend to be strongly affected by interest rate policy decisions. When interest rates decline, the present value of future dividends increases, which tends to lift stock prices.
Sectoral rotation can also follow the release of economic data. Some industries (such as luxury goods) tend to rise and fall with the economy, while others (such as utilities) do not. Depending on how the economic forecast evolves, calendar events can cause stock investors to shift between these sectors.
Commodities: Price changes and inflation hedging
The price of commodities, such as oil, copper, and wheat, tends to rise when the economy expands and demand increases. Thus, the economic calendar can directly impact commodity prices, as well as the valuation of associated futures contracts and commodity-linked ETFs. Some ‘commodity currencies,’ such as the New Zealand dollar (typically linked to agricultural goods), can also be used as tools to bet on the path of commodities.
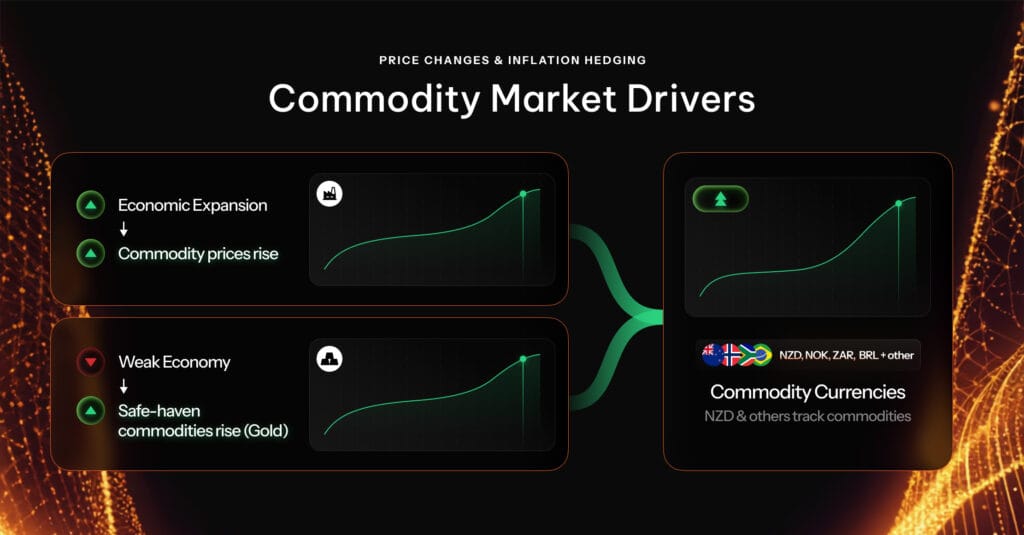
In contrast, some commodities actually tend to benefit when the economy worsens. Gold, for example, is often viewed as a safe-haven asset that behaves countercyclically. Inflation reports tend to be key events for commodities, since these goods can often play a key role in driving changes to cost-of-living indexes.
Bonds: Yields, spreads, and duration
Although individual traders often focus on asset classes like forex and equities, bonds can actually offer some of the most intriguing opportunities to play the economic calendar. Because so much of the economic calendar is fundamentally linked to interest rate expectations, fixed-income assets can move sharply in response to key events:
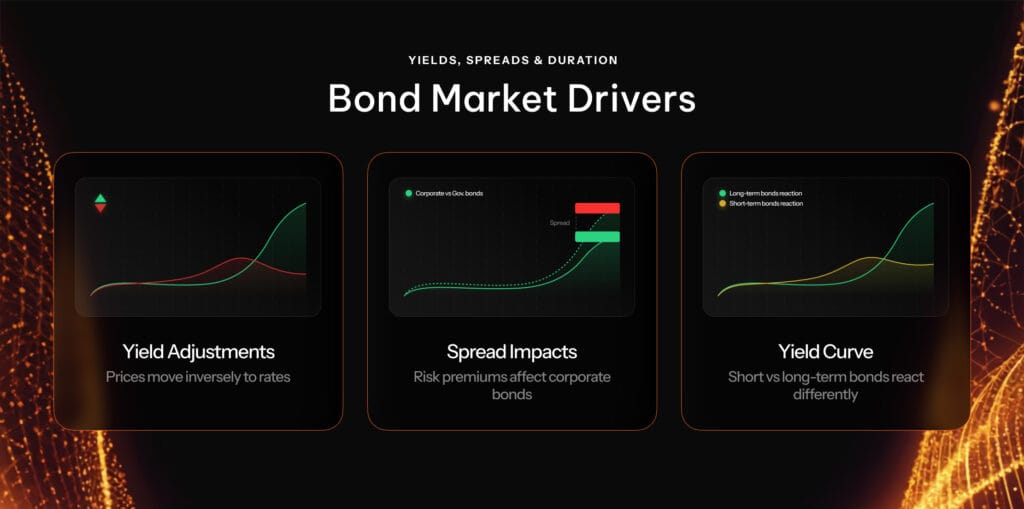
- Yield adjustments. Long-term bonds are often priced based on the expectation of future short-term interest rates. For example, a 10-year bond purchased today can be thought of as a sequence of 10 one-year bonds purchased over the next decade. As a result, changes to both current rates and expected future rates can impact market yields, which move inversely to the price of bonds.
- Spread impacts. Corporate bonds are generally priced at a ‘spread’ to government bonds, reflecting the riskiness of default by a non-sovereign issuer. In turbulent economic periods, spreads tend to increase, driven by the growing risks of either missed payments or outright defaults. As a result, strong economic data can cause spreads to shrink, thereby resulting in yields falling and bond prices rising.
- Duration and the yield curve. One advanced method of trading bonds is to hold specific positions along the ‘yield curve,’ which refers to the current market rates for bonds of varying maturities. These strategies, known as trading duration, can be impacted depending on whether the yield curve steepens or flattens based on calendar events.
Cryptocurrency: Risk sentiment and regulatory events
At first glance, the cryptocurrency market might seem to be disconnected from the fundamental data releases that populate the economic calendar. However, there are some notable links by which the calendar can still impact this asset class.

First and foremost, rising investor sentiment based on expectations of a stronger economy can boost all risk assets, including cryptocurrencies. So-called ‘altcoins’ tend to benefit strongly from this dynamic, but even tokens like Bitcoin and Ethereum can be affected too. Moreover, key political events can also drive changes in the crypto market. For example, the election of US President Donald Trump in 2024 was widely seen as contributing to a rally in cryptocurrency prices, following expectations of a more friendly regulatory environment.
Trading the Economic Calendar: Practical Strategies and Ideas
We’ve now discussed both the fundamentals of the economic calendar and the general ways in which key asset classes are affected. Using this knowledge, traders can begin effectively incorporating the economic calendar into their own market framework.
It’s important to note that many traders avoid taking significant positions near major news events on the economic calendar. That’s because these events often come with significant risk and uncertainty, with the resulting volatility potentially impairing a trader’s performance. In fact, for some traders, incorporating the economic calendar into their strategy might mean stepping away from markets during events like Fed meetings or CPI releases.
With that being said, traders who have carefully judged the risks and rewards can still capitalize on specific opportunities associated with the calendar. Trading the calendar generally involves three distinct approaches: pre-event positioning, trading the release, and post-event adjustments.
Pre-event positioning: Preparing for potential shifts
Since the release date and time for events on the economic calendar are known well in advance, it’s possible to position your portfolio ahead of time. Because markets are forward-looking, however, calendar events that play out exactly as expected usually don’t drive significant changes to market prices. As a result, there are two main strategies when placing a pre-event trade, each of which has different motivations.
Strategy #1: Betting that consensus forecasts are wrong
Calendar events typically come with an associated forecast, often calculated based on a consensus estimate among Wall Street banks or independent analysts. However, if you believe that these forecasts are wrong, you can potentially profit by trading against the consensus.
For example, suppose that Wall Street expects the upcoming US nonfarm payroll release to show that 200,000 jobs were added to the American economy over the previous month. In contrast, you believe that the actual figure will be much higher, closer to 300,000. Because an above-consensus result would indicate an economy that’s stronger than expected, risk assets like equities could gain, as might USD currency pairs.
It’s important to understand that consensus forecasts are typically developed by professionals who devote significant time and energy to try to accurately project economic figures. Although it’s certainly possible for individual traders to develop superior forecasts, it could be challenging without alternative data sources or proprietary economic modeling. What’s more, traders also need to be mindful of how they express their non-consensus view, since markets don’t always react in the expected manner.
Strategy #2: Betting that market prices are wrong
This second approach isn’t driven by an expectation that the forecasts about an event are wrong. Instead, it’s motivated by a belief that the prices driven by those forecasts are wrong – a subtle but important distinction.
For example, suppose that European stock prices are elevated ahead of a key interest rate decision by the ECB. Policymakers are expected to cut rates by 50 basis points, which is usually bullish for risk assets like stocks. While you also think that rates will be cut by 50 basis points, you believe that such an aggressive cut will actually end up spooking the markets, making investors realize that the economic outlook is worse than they thought.
In this case, even if the consensus forecast is correct, the interpretation of that forecast may not be. As such, a trader could potentially profit by taking a short position against European equities. Similar to the first strategy, this pre-positioning approach can be valuable if traders have a fundamental pricing insight that the rest of the market has overlooked.
Trading the release: Technical and high-frequency opportunities
Pre-event positioning is all about careful preparation. In contrast, trading the release is all about reacting immediately to seize on short-term opportunities. For traders poised to capture the moment, calendar events can offer profit potential in the seconds, minutes, and hours following their release:
- Riding momentum – Above- or below-consensus results can sometimes result in strong trending behavior in markets. For example, weak growth figures could result in associated currency pairs declining throughout the rest of the day as traders digest the news. If the trend lasts, traders can potentially ride this momentum to profit.
- Anticipating mean reversion – In sharp contrast to momentum, some markets also exhibit mean reversion in the wake of unexpected data. Traders may initially overreact to surprises before realizing that the impacts may not be as significant as they thought. Understanding when a trend will continue or revert depends on identifying robust set-ups and studying the historical behavior of a specific market.
- Scalping high volumes – Regardless of whether prices rise or fall, it’s common for markets to experience significantly higher volume following economic events as traders adjust their portfolios. That higher volume can potentially boost profitability for scalpers and other traders using order flow strategies, since it often provides more opportunities to repeatedly collect a few pips in profit.
While all these strategies can be viable methods to profit from trading the release, it’s also important to be aware of potential pitfalls ahead of calendar events. For example, it’s not uncommon for bid-ask spreads to widen ahead of key events based on a rise in expected volatility, which can increase trading costs. What’s more, since a trader’s preferred market may not be open when a calendar event occurs, it can sometimes be challenging to trade releases in practice.
Post-event adjustments: Repositioning your portfolio
Positioning your portfolio ahead of key events and trading the release are generally the most viable methods for profiting from the economic calendar. However, it’s important not to overlook the value of making post-event adjustments. Even for traders who do not profit immediately from a calendar event, the associated decisions, data, or projections can still inform their portfolio strategy.
For example, growth projections from the IMF rarely trigger a major market reaction. Nonetheless, these figures can still be utilized by a forex trader updating their fair value calculations for major currency pairs. Similarly, forward guidance from central banks might cause traders to review which markets they want exposure to in light of adjustments to future rate expectations.
Ultimately, whether a trader attempts to profit from calendar events before, during, or after their occurrence depends on their personalized strategy and market framework. What’s more, this decision will be driven by what a trader believes to be their unique source of ‘alpha’ – the factor that allows them to generate profitable returns. By effectively weighing all three avenues and developing a sophisticated understanding of these events, traders can give themselves the best chance of profiting from the economic calendar.
Conclusion: Avoiding Pitfalls and Developing Your Calendar
Trading the economic calendar is not without potential pitfalls. In particular, it can be tempting to overtrade in the wake of key events before investors have had the chance to fully incorporate new information. Moreover, headline figures can sometimes be misleading, requiring traders to dive deeper into data releases.
Nonetheless, incorporating the economic calendar into your overall trading strategy can be a useful way to both capitalize on new information as well as manage risks associated with potential shifts. While many platforms include a built-in economic calendar, traders can also build their own personalized schedule with custom calendar software. That can be especially useful for traders focused on niche or specialized areas, where key events may be overlooked by the broader market.
For traders who’ve effectively incorporated the economic calendar into their trading strategy and are now looking to boost profits, consider pursuing a prop account with OneFunded. Prop traders can unlock extra capital to increase their position sizes and take their strategy to the next level. With competitive profit splits, a refundable challenge fee, and a wide variety of account sizes, begin your OneFunded trading challenge today.